AEB 0070
November 2022
Orchard Economics:
The Costs and Returns to
Establish and Produce
Sweet Cherries in a High-Density and
Ultra-High-Density Orchard
In Wasco County
Ashley Thompson, Clark Seavert, and Lynn Long

| P a g e
1
Orchard Economics: The Costs and Returns to Establish and Produce Sweet
Cherries in a High-Density and Ultra-High-Density Orchard in Wasco County
Ashley Thompson, Clark Seavert, and Lynn Long*
Introduction
Cherry growers worldwide have
moved mainly to high-density plantings on
semi-dwarfing or dwarfing rootstocks. This
affords several advantages, including greater
precocity, faster return on investment, the
potential for higher annual yields, easier
maintenance, increased worker efficiency,
and the ability to protect the orchard more
easily from rain, hail, and bird damage.
However, with these advantages come
significant production risks. A high-density
system on dwarfing rootstock is less
forgiving than a standard-density orchard.
Improper management can mean small,
poor-quality fruit. Poor pruning can lead to
excessive shading and spur death, and lack
of vigor can increase pest and disease
attacks. For these reasons, it is essential that
growers properly evaluate their
scion/rootstock choices in relation to the
proposed orchard site while critically
assessing their own management skills
before deciding to plant a high- or ultra-
high-density orchard.
This study is intended for growers and
investors considering the economic and
financial consequences of planting a high-
density or ultra-high-density sweet cherry
orchard. It is impossible to cover all variety,
rootstock, and training system combinations
in a publication of this type, so combinations
commonly grown in Wasco County were
chosen for comparison.
Assumptions for Both the High-
and Ultra-High-Density Systems
In the preparation of this publication,
assumptions were made that reflect current
trends in orchard design for establishing a
sweet cherry orchard. These assumptions
are:
1. Farm size. The typical size operation in
Wasco County growing fruit is 100 acres.
2. Land. The market value of irrigated land
with no fruit trees is $15,000 per acre.
3. Grower returns. The average sweet
cherry prices are $0.85 per pound
returned to the grower after subtracting
packing costs.
4. Tree density and acres. The typical
acreage for a sweet cherry farm includes
45 acres of standard density, 45 acres of
high-density, and 5 acres of ultra-high-
density plantings, all producing fresh
market sweet cherry varieties.
Approximately 5 percent, or 5 acres, of
the orchard is non-bearing fruit trees.
Generally, standard density orchards have
less than 300 trees per acre, ultra-high-
density orchards greater than 660, and
high-density orchards in between.
5. Labor. Beginning in Year 0, general
orchard labor is paid $16.75, tractor
drivers $20.25, supervisory labor $24.50
per hour, and workers harvesting cherries
are paid a piece rate of $0.26 per pound.
All rates include worker's compensation,
unemployment insurance, and other
overhead expenses; therefore, all general,
tractor, supervision, and harvest labor are
cash variable costs. In addition, labor
rates increase three percent annually for
inflation in subsequent years after Year 0.
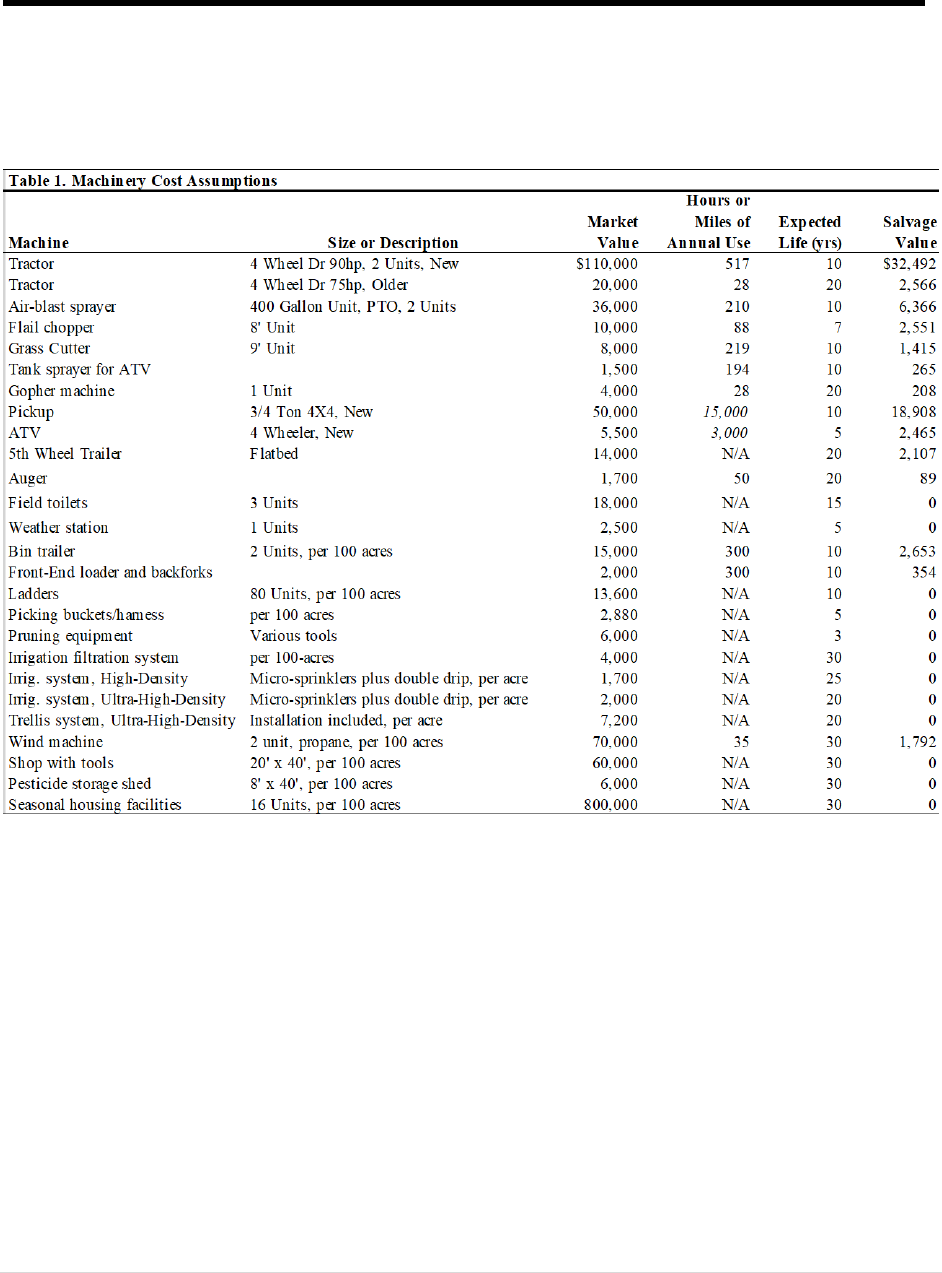
6. Machinery and equipment. The
machinery and equipment reflect the
typical machinery complement of a 100-
*Ashley Thompson, Extension Horticulturalist,
Wasco and Hood River counties, Department of
Horticulture, Clark Seavert, Professor Emeritus,
Department of Applied Economics, and Lynn
Long, Professor Emeritus, Department of
Horticulture, all at Oregon State University.
| P a g e
2
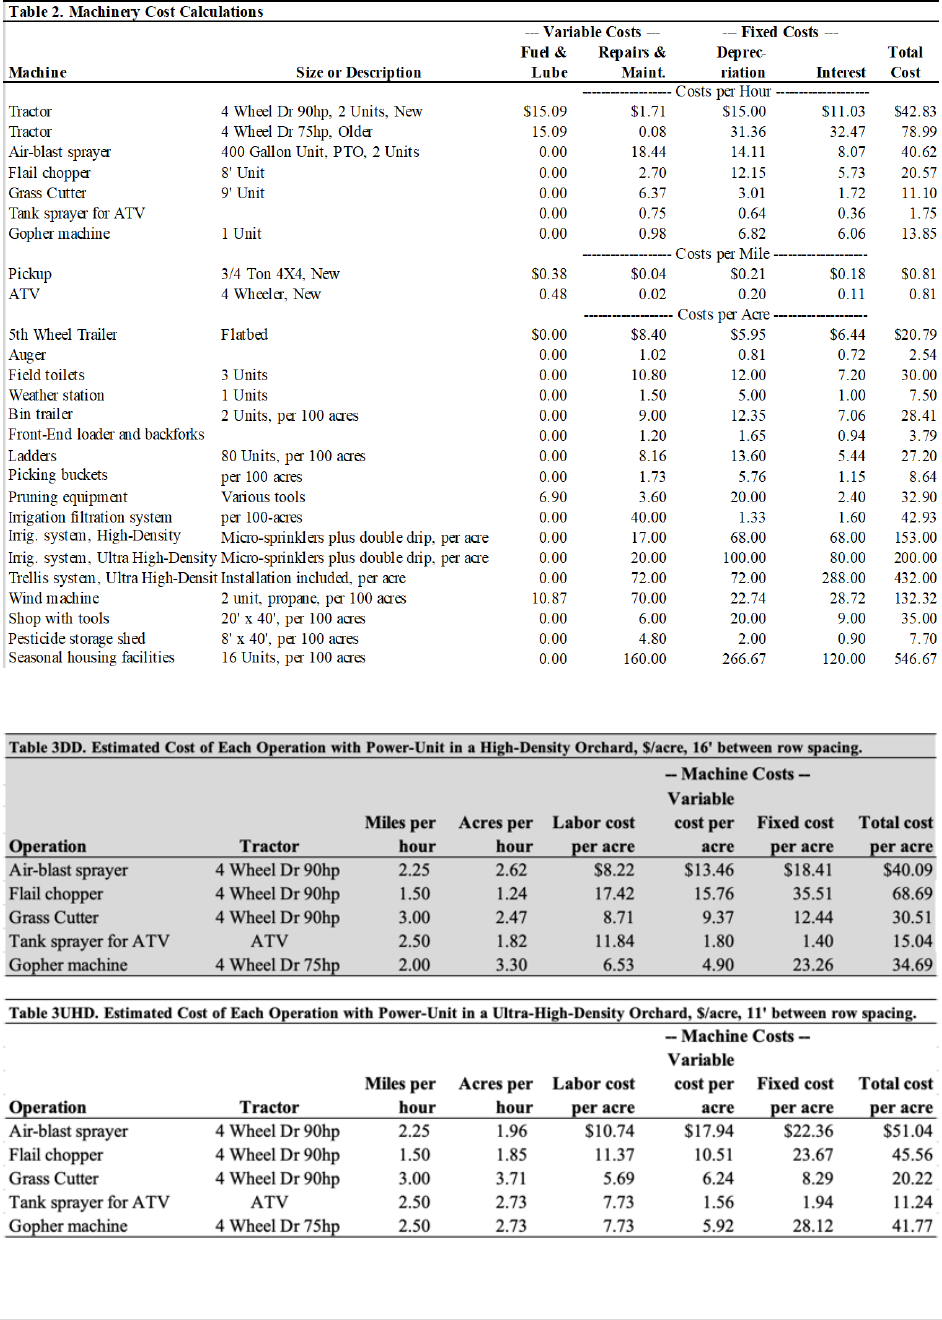
acre farm in Wasco County (Appendix A,
Tables 1 and 2, pages 12 and 13). A 90-
hp tractor is used to pull an air-blast
sprayer, flail chopper, grass cutter, and
assist during harvest. A 75-hp tractor is
used to harvest. An ATV is equipped
with a tank sprayer for weed control.
7. Fuel. Gasoline, diesel, and propane costs
are $4.00, $4.00, and $2.25 per gallon.
8. Interest. The interest rate on operating
funds is eight percent, treated as a cash
expense. One-half of the cash expenses
are borrowed for six months.
9. Machinery, labor housing, and land are
owned and assessed at an eight, three,
and four percent interest rate,
respectively, and treated as a fixed non-
cash opportunity cost to the owner.
10. The operator funded the establishment
costs of this orchard at a charge of six
percent interest and treated it as a fixed
non-cash opportunity cost.
11. Chemicals. Herbicides used for strip
maintenance are applied to 30 percent of
each acre.
12. Housing. Seasonal labor facilities
provided by the owner cost $800,000.
Sixteen five-person units are required for
this size of operation. A charge of $0.02
per pound of harvested cherries is
assessed for picker camp maintenance
during harvest.
13. Irrigation systems. A micro-sprinkler
plus double-drip irrigation system is used
in both the high-density and ultra-high-
density orchard systems at an estimated
cost of $1,700 and $2,000 per acre,
respectively.
14. Frost control. Two wind machines are
valued at $35,000 each.
15. Shop and tools. A shop building with
equipment and tools is valued at $60,000.
16. Replacement cost calculations.
Replacement costs for irrigation systems,
wind machines, housing, buildings, and
trellis system are calculated using the
straight-line method of depreciation
((purchase price - salvage value) ÷ total
acres, if the purchase price is not on an
acre basis).
17. Interest calculations. Interest charges
for irrigation systems, wind machines,
housing, buildings, and trellis system are
calculated using the average value of the
system multiplied by an interest rate
((((purchase price + salvage value) ÷ 2) x
interest rate) ÷ total acres, if the purchase
price is not on an acre basis).
18. Repairs and maintenance calculations.
Repair and maintenance for irrigation
systems, wind machines, buildings, and
trellis system costs are calculated using
one percent of the per acre purchase price
per year. Housing is two percent of the
purchase price.
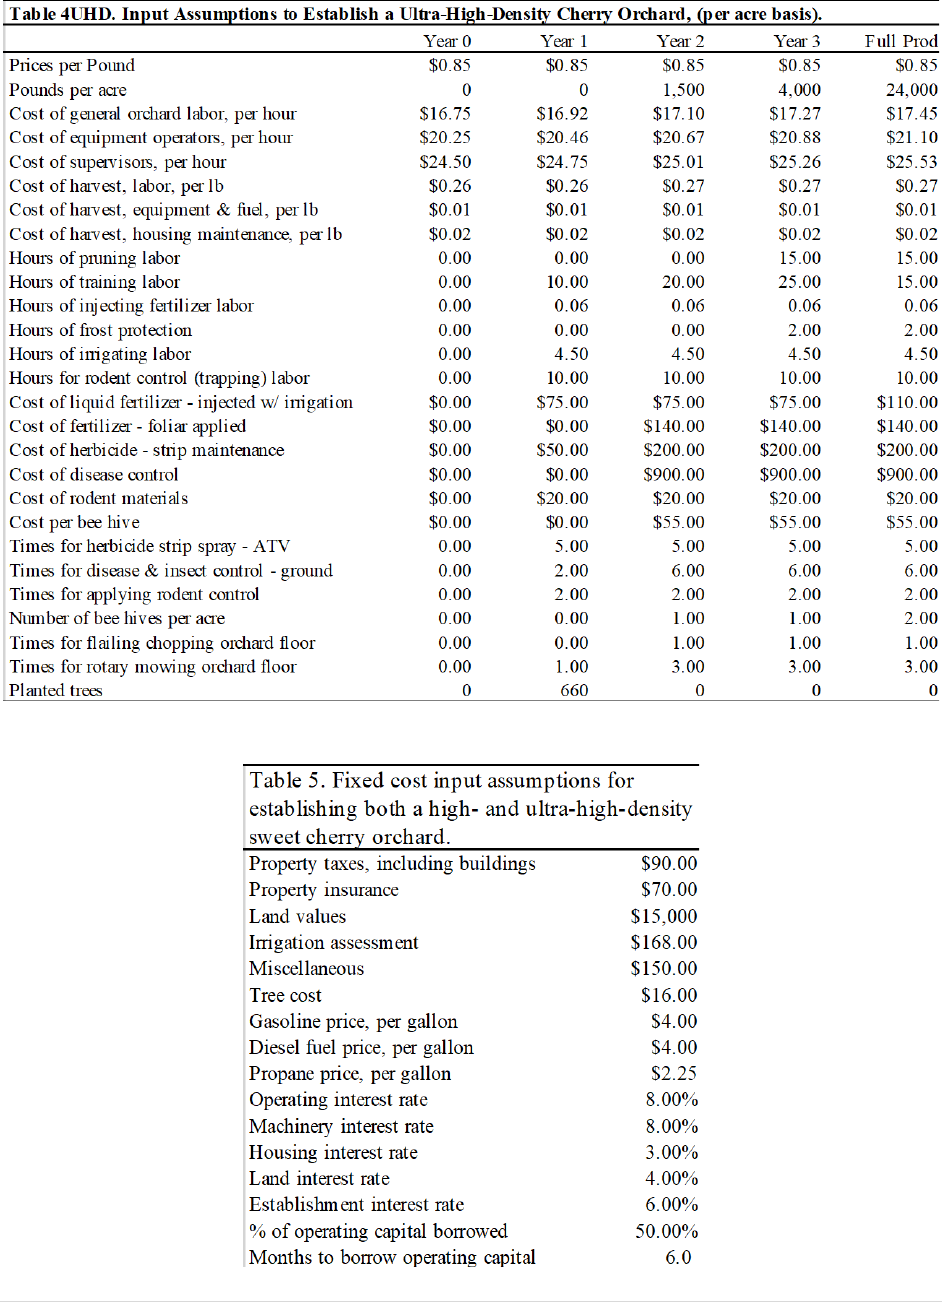
19. Fixed costs. Fixed cost input
assumptions are listed in Appendix B,
Table 5, page 15.
20. Omitted from this study. Not included
in this study is a return to management,
owner labor, family living withdrawals,
an accounting for all regulatory costs,
annual price and yield volatility, price
inflation, and local, state, and federal
income taxes paid by the owner.
High-Density Orchard Assumptions
21. Orchard description. This orchard is
planted to a spacing of 10' x 16' (340
cherry trees per acre), with 11 percent
pollinizer trees.
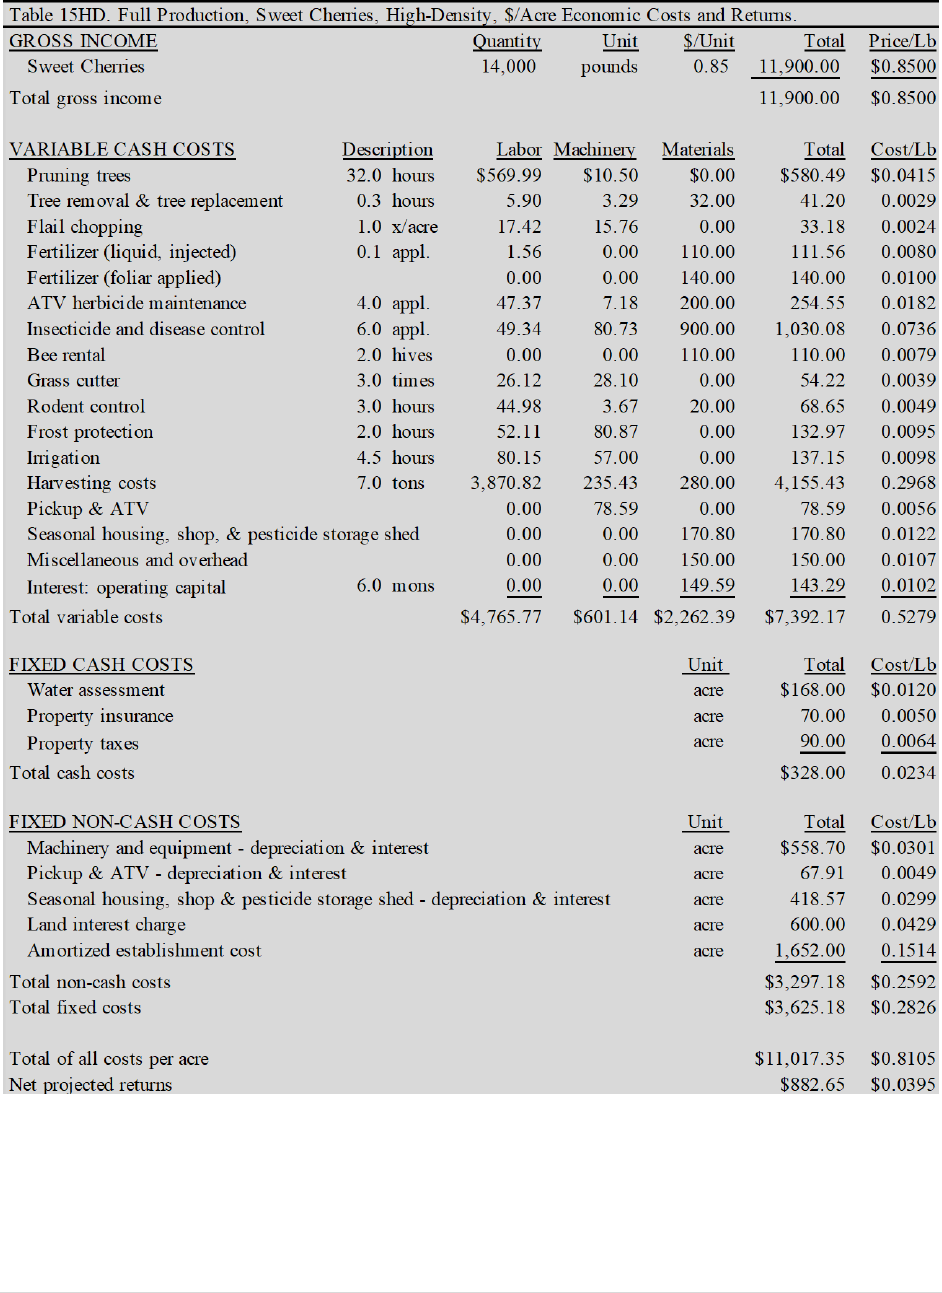
22. The productive life of this orchard is 25
years once full production of 14,000
pounds of field-run cherries per acre is
reached.
23. Trees in this system are trained to a
central leader system.
24. Sweet cherry yields. Commercial yields
begin in year 3, and full production is
reached five years after planting with
1,000, 5,000, 10,000, and 14,000 pounds
per acre, respectively.

| P a g e
3
25. Machine costs per acre. Appendix A,
Table 3HD, page 13, lists the estimated
costs per acre for each machine operation
with an 16' tree row spacing.
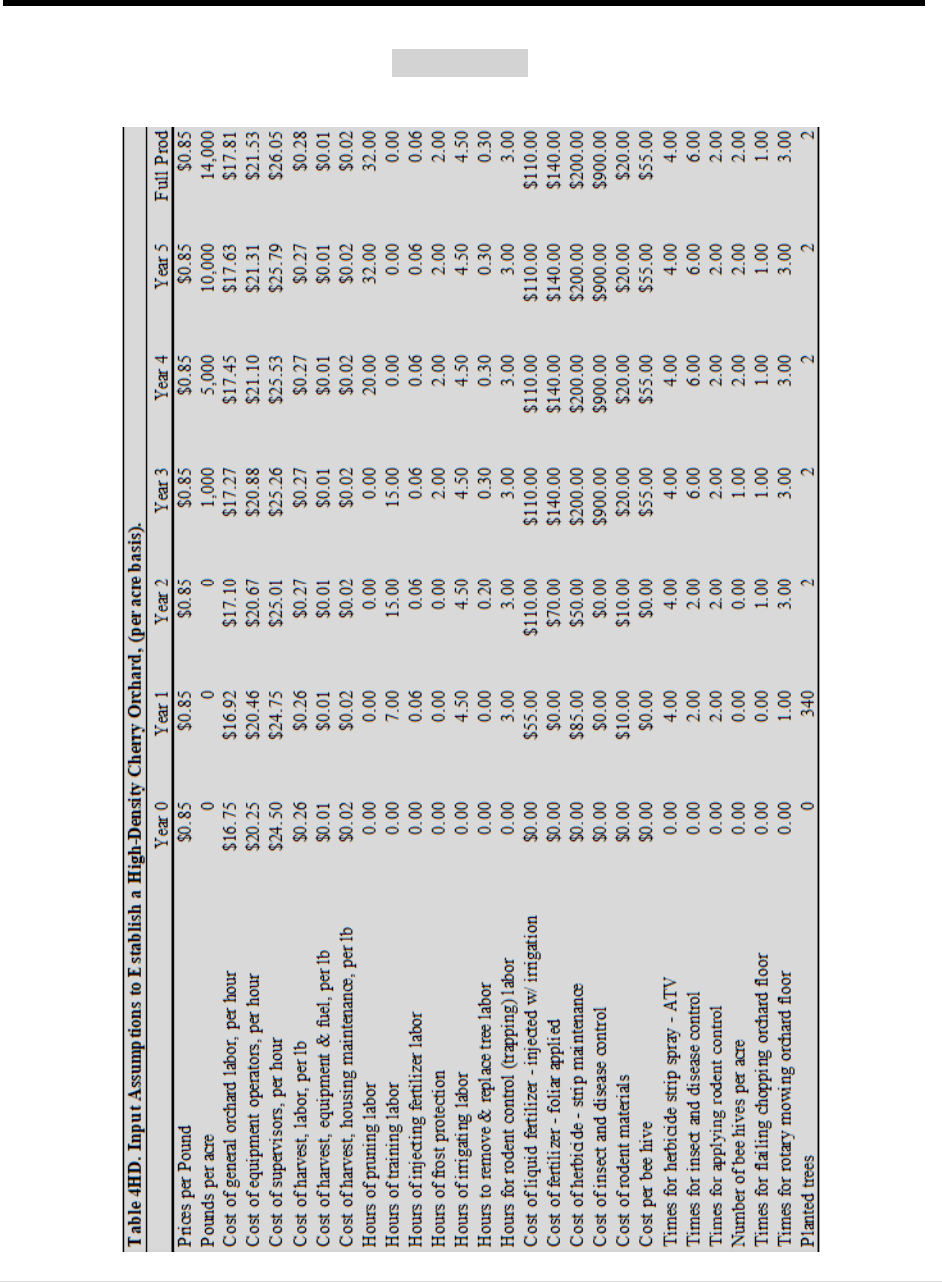
26. Other assumptions. Other assumptions
for variable, cash fixed, and non-cash
fixed costs are listed in Appendix B,
Table 4HD, page 14.
Ultra-High-Density Orchard
Assumptions
27. Orchard description. This orchard is
planted to a spacing of 6' x 11' (660
cherry trees per acre), with 11 percent
cherries as pollinizers.
28. The productive life of this orchard is 20
years once full production of 24,000
pounds of field-run cherries per acre is
reached.
Results of establishing a high-
density cherry orchard
Cash flow analysis
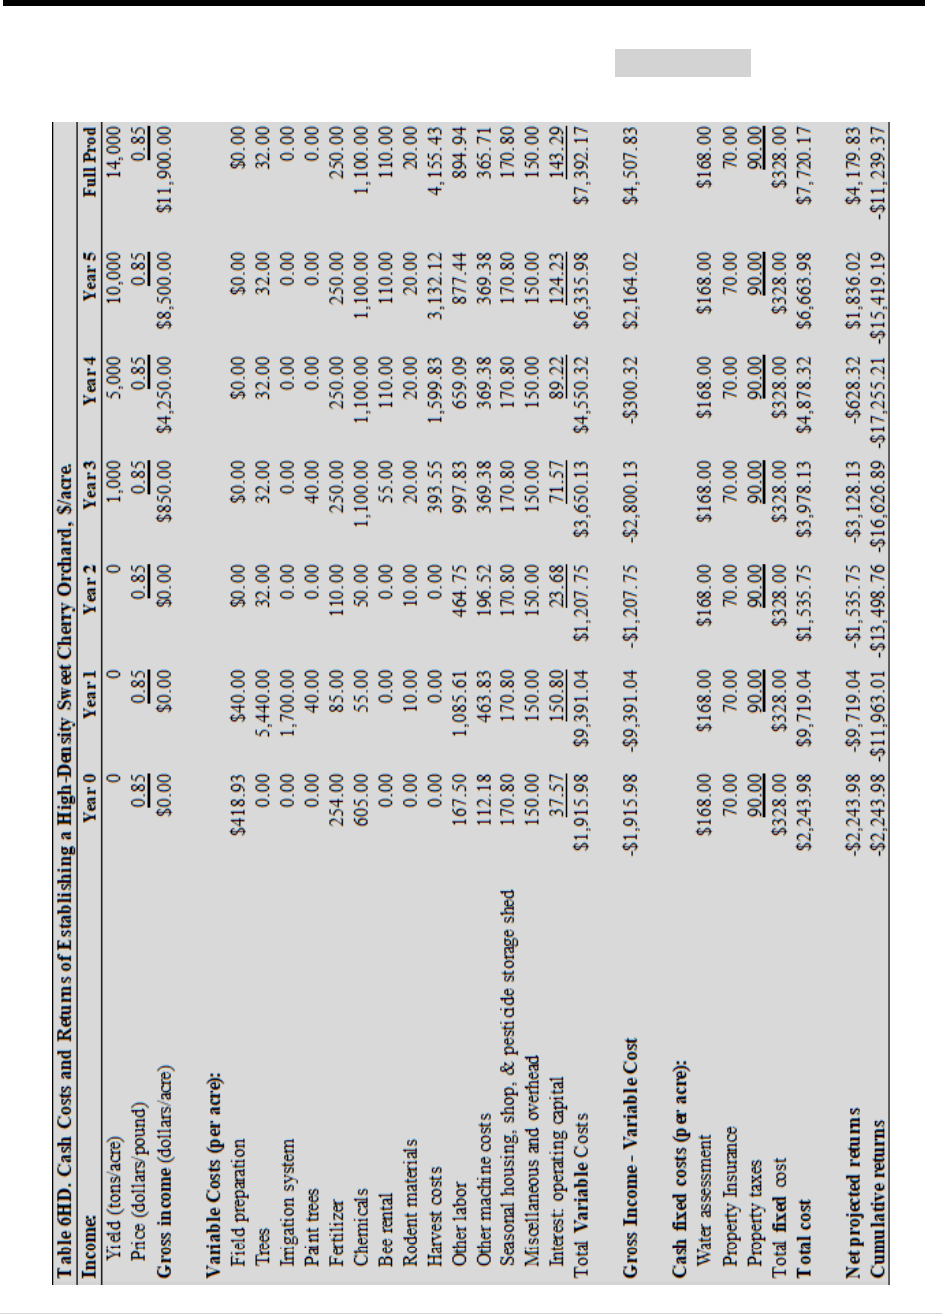
A cash flow analysis for establishing a
high-density cherry orchard is presented in
Appendix C, Table 6HD, page 16. It shows
the cash costs required to develop this type
of orchard. Cash costs include labor, trees,
irrigation system, fertilizer, chemicals,
beehives, machinery repairs, fuel, lube and
oil, labor housing repairs and maintenance,
operating (short-term) interest, machinery
and whole-farm insurance, irrigation water
assessments, and property taxes. The
income, variable costs, and cash fixed costs
are shown for each of the six establishment
years plus the first full production year.
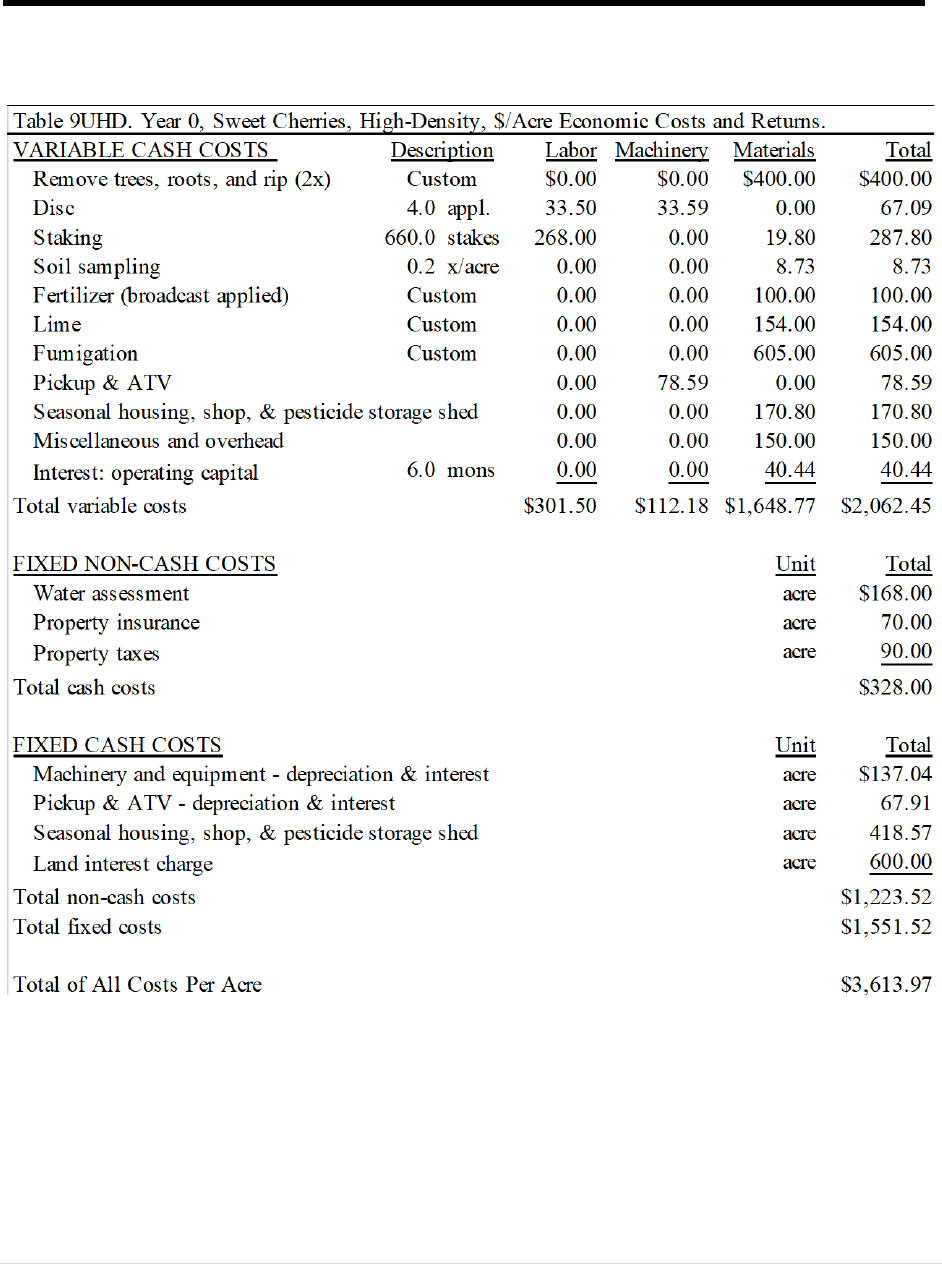
Total variable costs are $1,916 in year 0,
with an additional $328 of cash fixed costs
for a total cash cost of $2,244 per acre. In
year 0, the old orchard trees are removed,
and the ground is prepared for planting
29. Trees in this system are trained to a
spindle system on to a trellis
30. Sweet cherry yields. Commercial yields
begin in year 2, and full production is
reached three years after planting with
1,500, 4,000, and 24,000 pounds per acre,
respectively.
31. Trellis system. The trellis system costs
$7,200 per acre installed.
32. Machine costs per acre. Appendix A,
Table 3UHD, page 13 lists the estimated
costs per acre for each machine operation
with a 11' tree row spacing.
33. Other assumptions. Other assumptions
for variable, cash fixed, and non-cash
fixed costs are listed in Appendix B,
Table 4UHD, page 15.
young trees the following year.
A positive cash flow begins in year 5 with
gross income exceeding total cash costs by
$1,836 per acre. However, the orchard does
not return a sufficient gross income to pay
all previous years’ cash costs at full
production. There is $11,289 per acre of
cumulative cash flows remaining over and
above prior expenses.
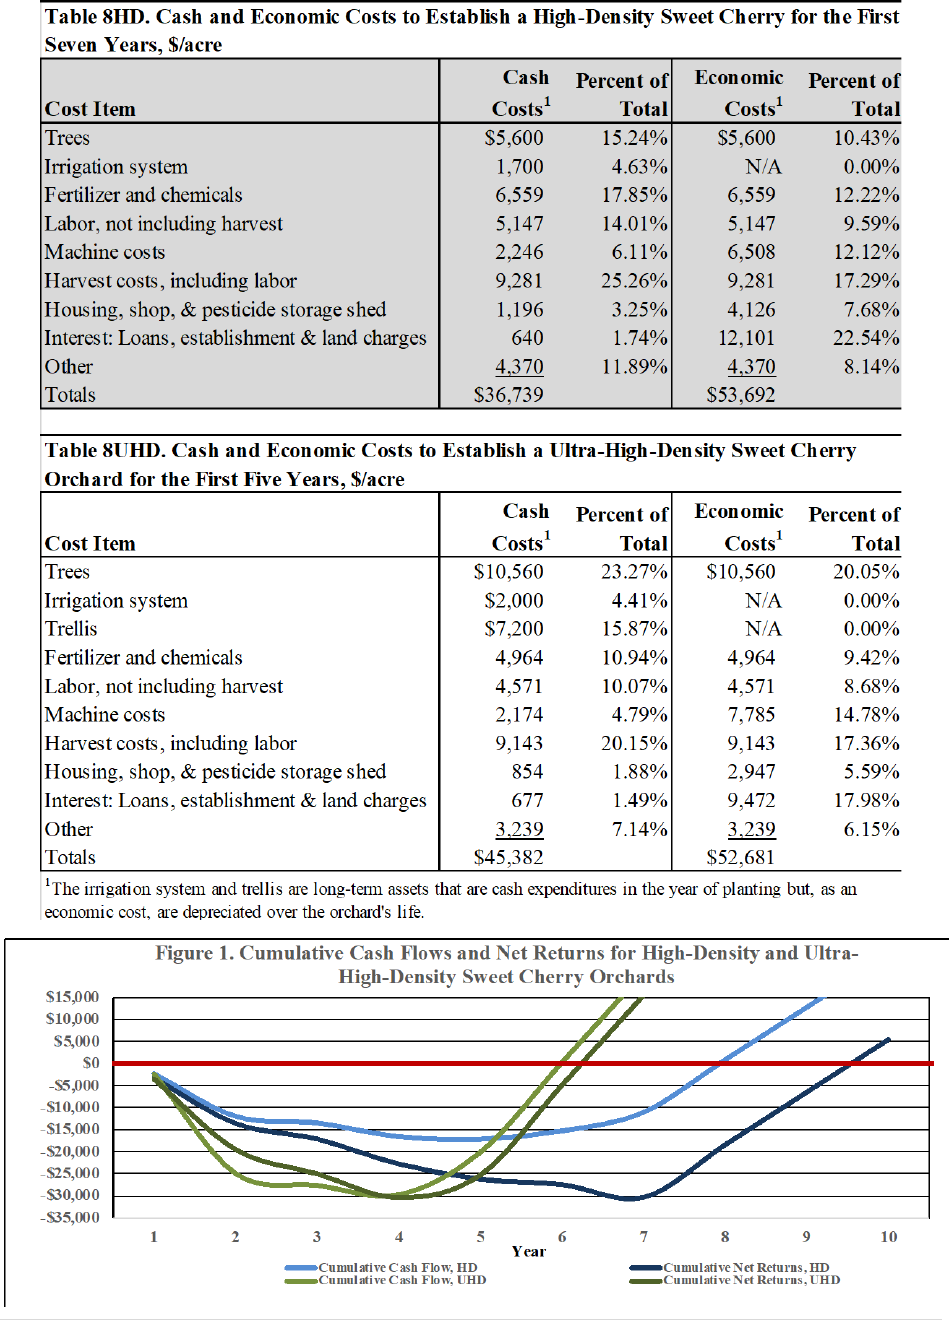
The major cost components to total cash
costs are shown in Table 8HD, page 20.
Harvest costs represents 25 percent of the
total cash costs to establish this orchard.
Fertilizer and chemicals are the second-
largest item, making up 18 percent of the
total cash costs. Trees and labor, not
including harvest labor, is 15 and 14
percent, respectively, of the cash costs. The
remaining four items comprise about 28
percent of the total cash costs.
Economic costs and returns
The economic costs and returns for
establishing a high-density cherry orchard
are shown in Appendix C, Table 7HD, page
17. Economic costs include all cash out-of-

| P a g e
4
pocket and ownership costs, which consist
of a combination of principal and interest
payments and a return on investment to the
grower, or both, for machinery, housing,
land, and funds to pay previous years’
establishment costs. The gross income and
variable cash costs remain the same as in
Table 6HD, except the irrigation system are
amortized over their productive life and
included in fixed costs.
Net projected returns (gross income
minus total costs) become positive at full
production, with gross income exceeding
total costs of $415 per acre. At the end of
the establishment period, $27,723 per acre
remains to repay all previous establishment
costs. This cost is amortized over 25 years
as an annual payment of $1,652 per acre,
including principal and interest, to recover
the capital investment of establishing the
orchard.
The major cost components as a percent
of total economic cost are shown in Table
8HD, page 20. When all expenses are
Results of establishing a Ultra-high-
density cherry orchard
Cash flow analysis
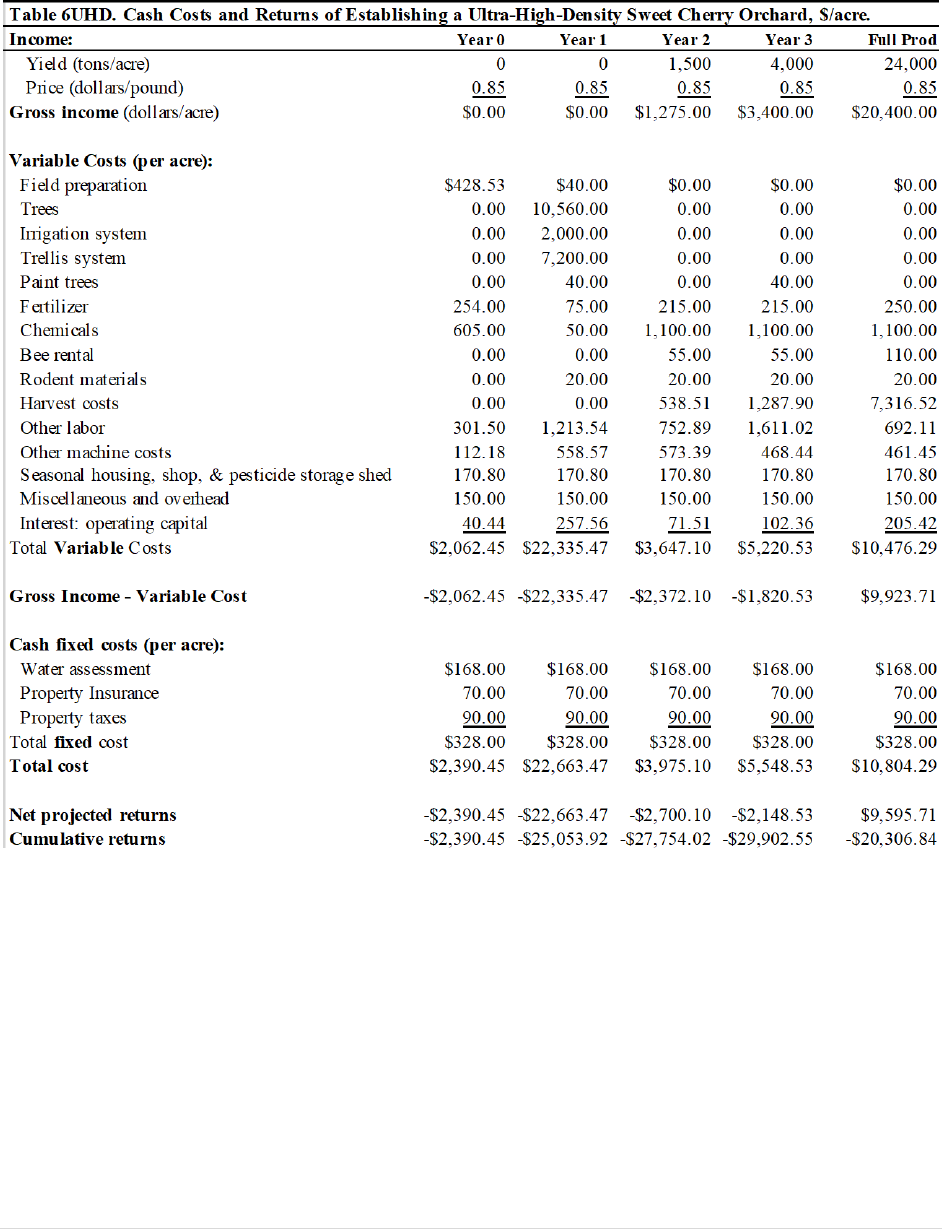
A cash flow analysis for establishing an
ultra-high-density cherry orchard is
presented in Appendix C, Table 6UHD,
page 18. It shows the cash costs required to
develop this type of orchard. Cash costs
include labor, trees, irrigation system, trellis,
fertilizer, chemicals, beehives, machinery
repairs, fuel, lube and oil, labor housing
repairs and maintenance, operating (short-
term) interest, machinery and whole-farm
insurance, irrigation water assessments, and
property taxes. The income, variable costs,
and cash fixed costs are shown for each of
the four establishment years plus the first
full production year. Total variable costs are
$2,062 in year 0, with an additional $328 of
included, the top two items are charges and
harvest costs at about 23 and 18 percent,
respectively. Fertilizer and chemicals, trees,
and machine costs follow at 13, 11, and 10
percent, respectively. The remaining four
cost items comprise about 25 percent of the
total economic costs.
Summary of establishing a high-density
orchard
Figure 1, page 20, shows the cumulative
cash flow and economic costs of
establishing a high-density orchard. The
light and darker blue lines denote these
results. The cumulative cash flow turns
positive by $661 in year 8, and the
cumulative economic returns by $7,508 in
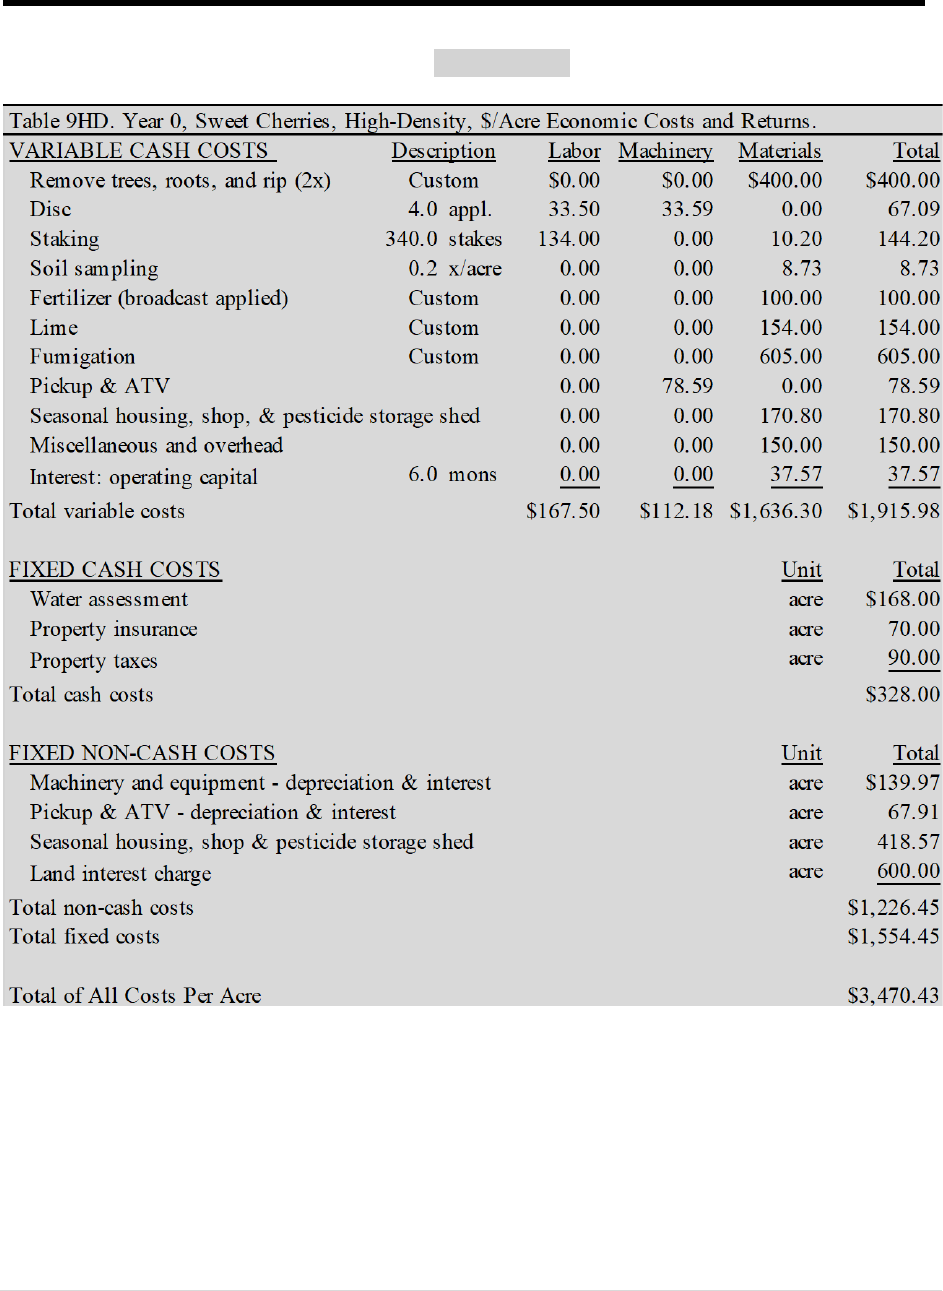
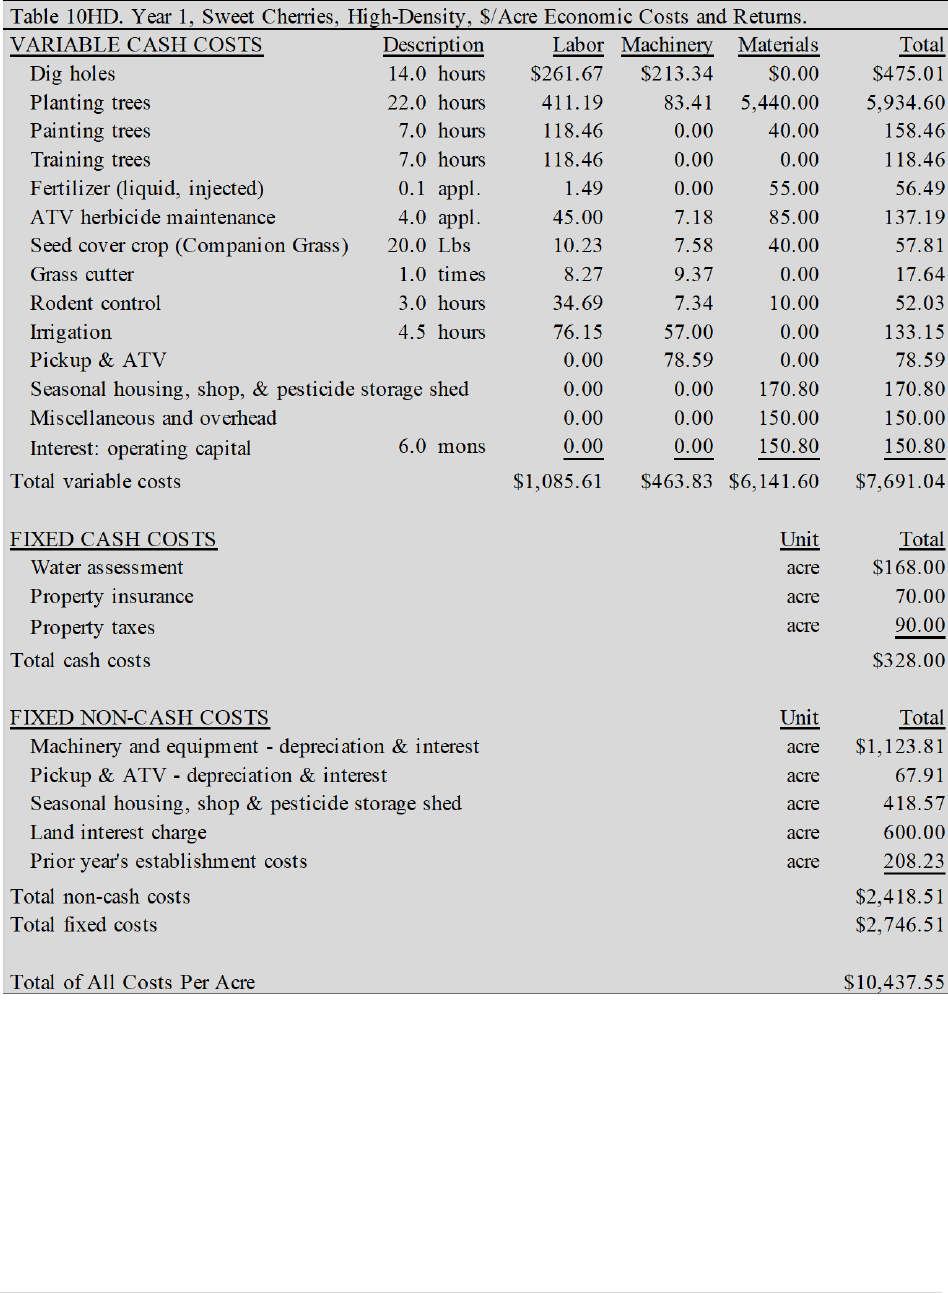
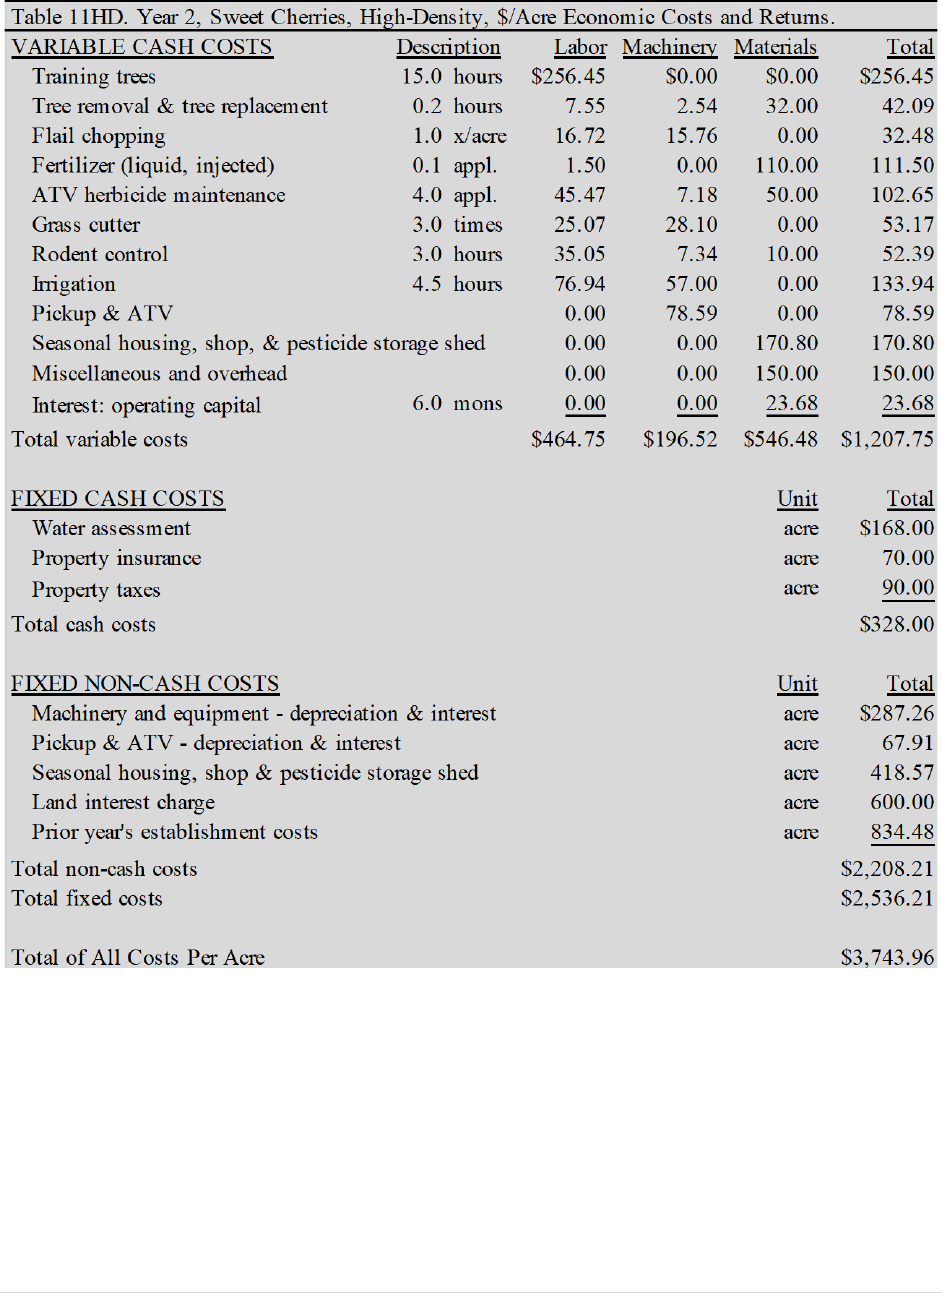
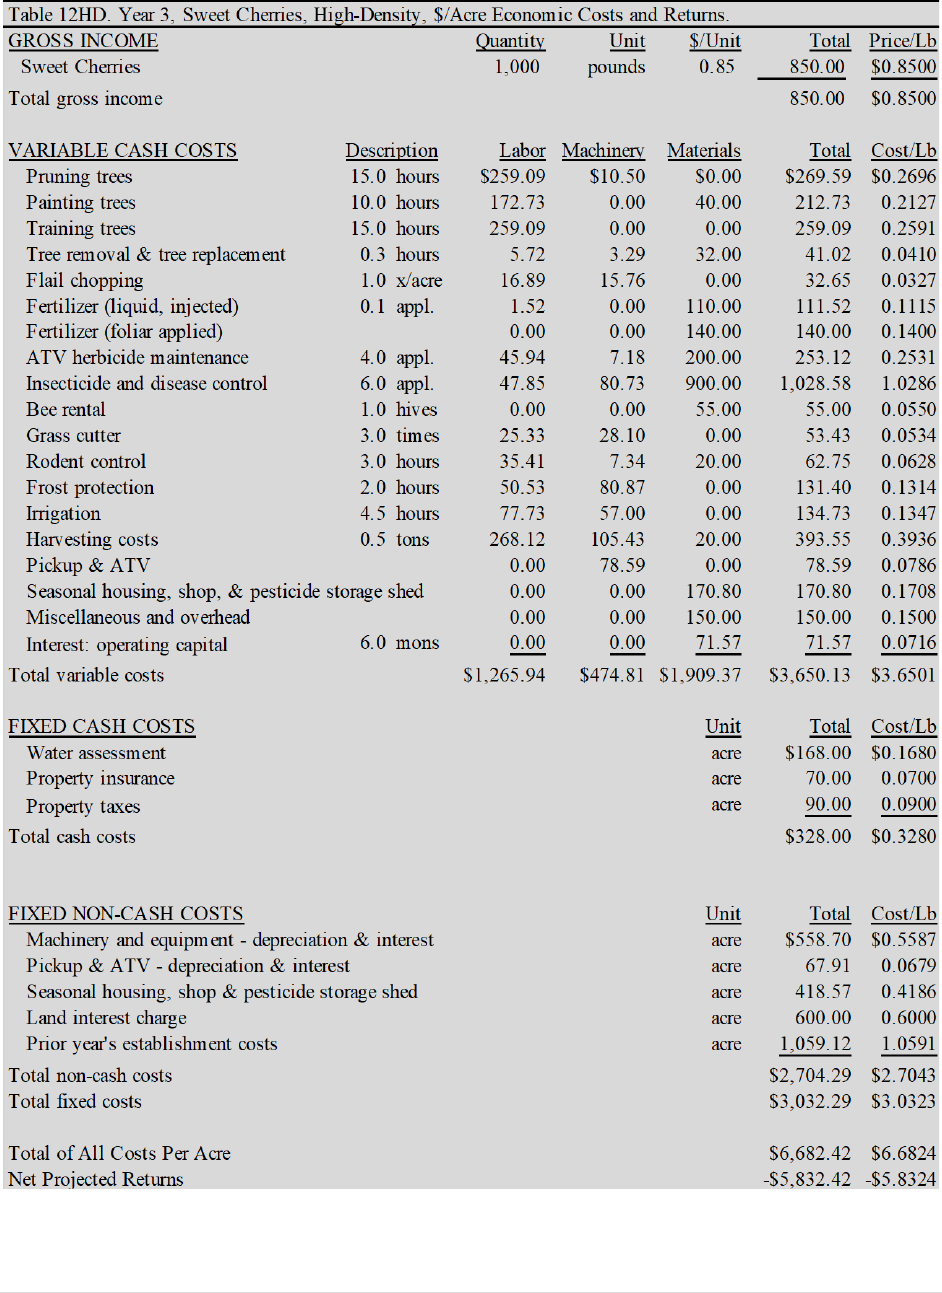
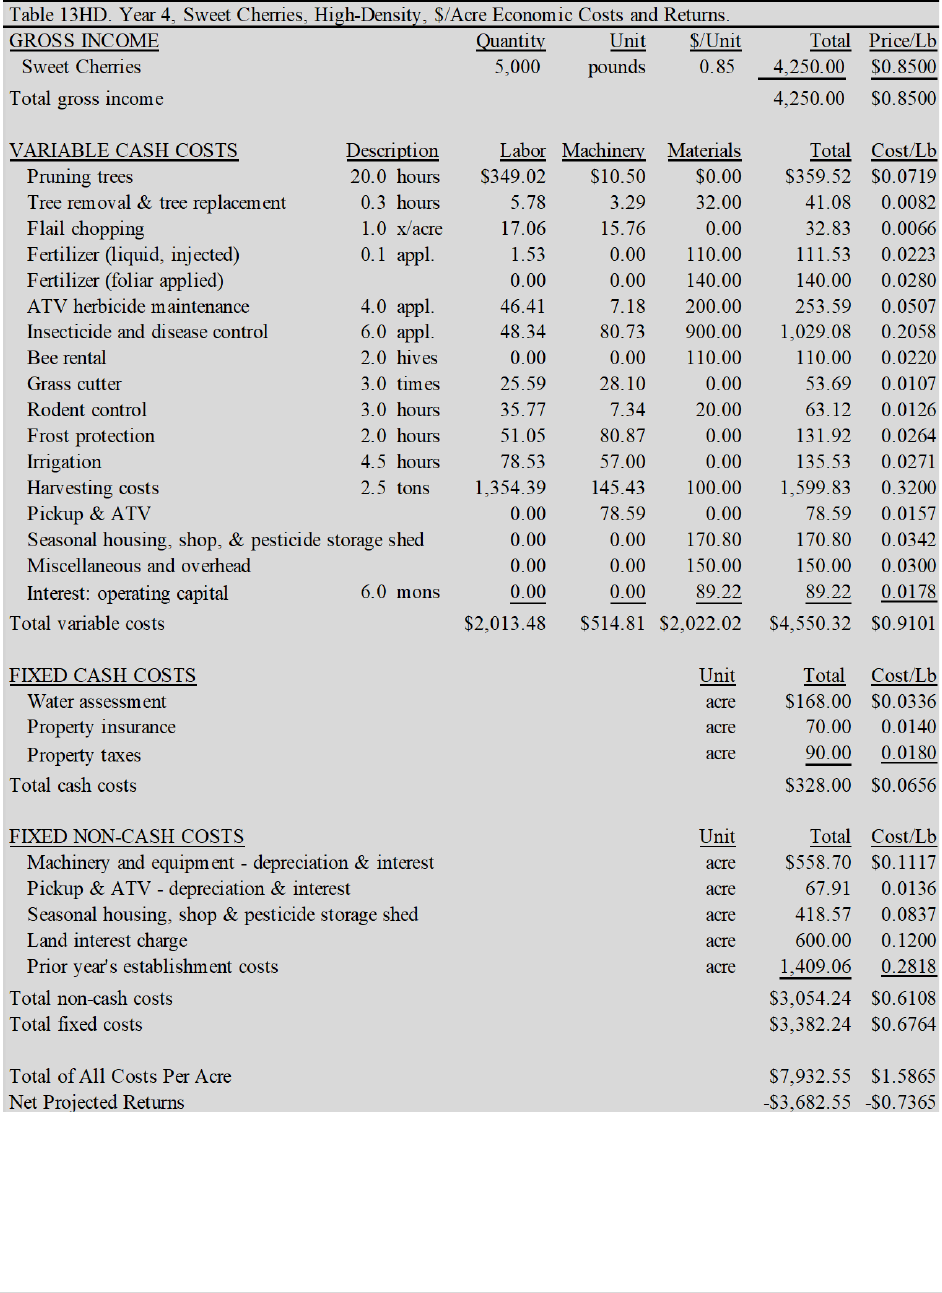
year 10. Appendix D, Tables 9HD-15HD,
pages 21-27, contains the annual cost and
return budgets for establishing this high-
density orchard.
cash fixed costs for a total cash cost of
$2,390 per acre. As in the high-density
system, in year 0, the old orchard trees are
removed, and the ground is prepared for
planting young trees the following year.
A positive cash flow begins at full
production with gross income exceeding
total cash costs by $9,596 per acre.
However, the orchard does not return a
sufficient gross income to pay all previous
years’ cash costs; there is $20,306 per acre
remaining over and above prior expenses.
The major cost components to total cash
costs are shown in Table 8UHD, page 20.
Tree costs represents 23 percent of the total
cash costs to establish this orchard. Harvest
costs are the second-largest item, making up
20 percent of the total cash costs. The trellis
system, fertilizer and chemicals, and all
labor, not including harvest labor, is 16, 11,

| P a g e
5
and 10 percent, respectively. The remaining
five items comprise about 20 percent of the
total economic costs.
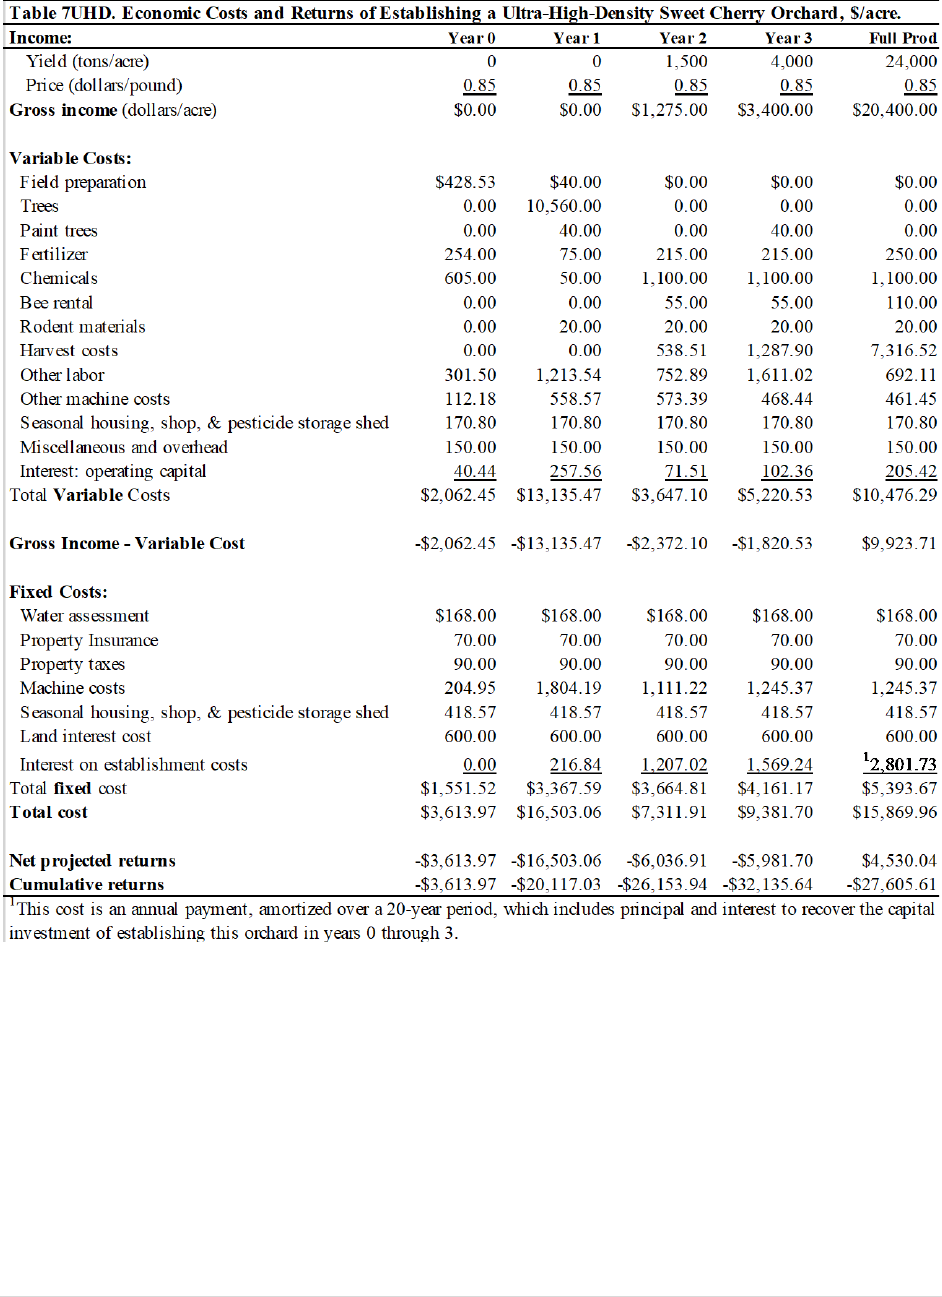
Economic costs and returns
The economic costs and returns for
establishing an ultra-high-density cherry
orchard are shown in Appendix C, Table
7UHD, page 19. Economic costs include all
cash out-of-pocket and ownership costs,
which consist of a combination of principal
and interest payments and a return on
investment, or both, to the grower for
machinery, housing, land, and funds to pay
previous years’ establishment costs. The
gross income and variable cash costs remain
the same as in Table 6UHD, except the
irrigation system and trellis are amortized
over their productive life and included in
fixed costs.
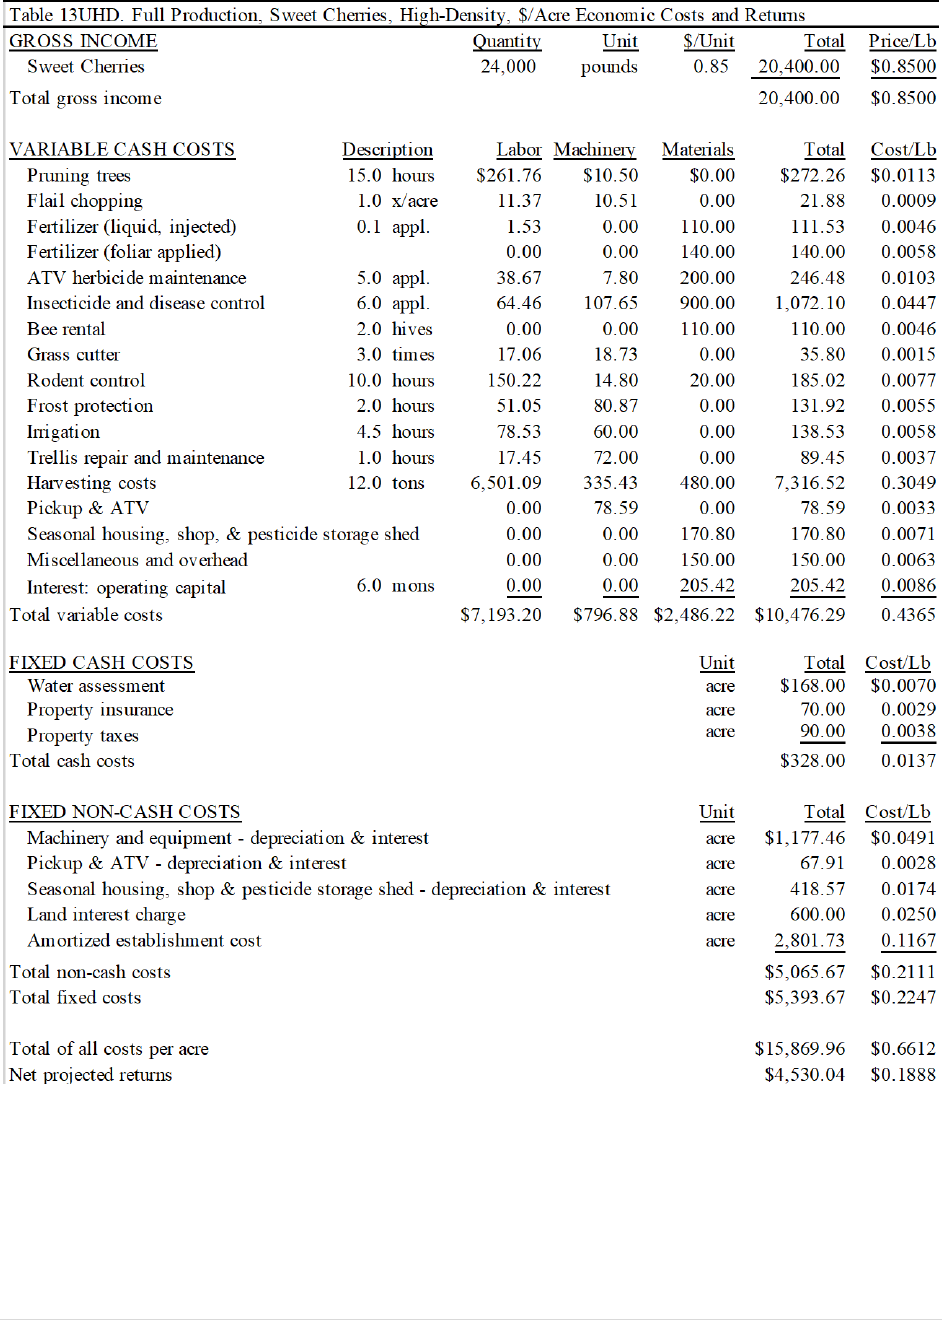
Net projected returns (gross income
minus total costs) become positive at full
production, with gross income exceeding
total costs of $4,530 per acre. At the end of
the establishment period, $27,606 per acre
remains to repay all previous establishment
costs. This cost is amortized over 20 years
as an annual payment of $2,802 per acre,
including principal and interest, to recover
the capital investment of establishing the
orchard.
The major cost components as a percent
of total economic cost are shown in Table
8HD, page 20. When all expenses are
included, the top item is trees at 20 percent
of the total economic costs. Next, interest
charges and harvest costs are 18 and 17
percent, followed by machine costs and
fertilizer and chemical costs at 15 and 9
percent, respectively. The remaining four
cost items comprise about 21 percent of the
total economic costs.
Summary of establishing an ultra-high-
density orchard
Figure 1, page 20, shows the cumulative
cash flow and net returns of establishing a
ultra-high-density orchard. The light and
darker green lines denote these results. The
cumulative cash flow turns positive by $93
in year 6, and the cumulative economic
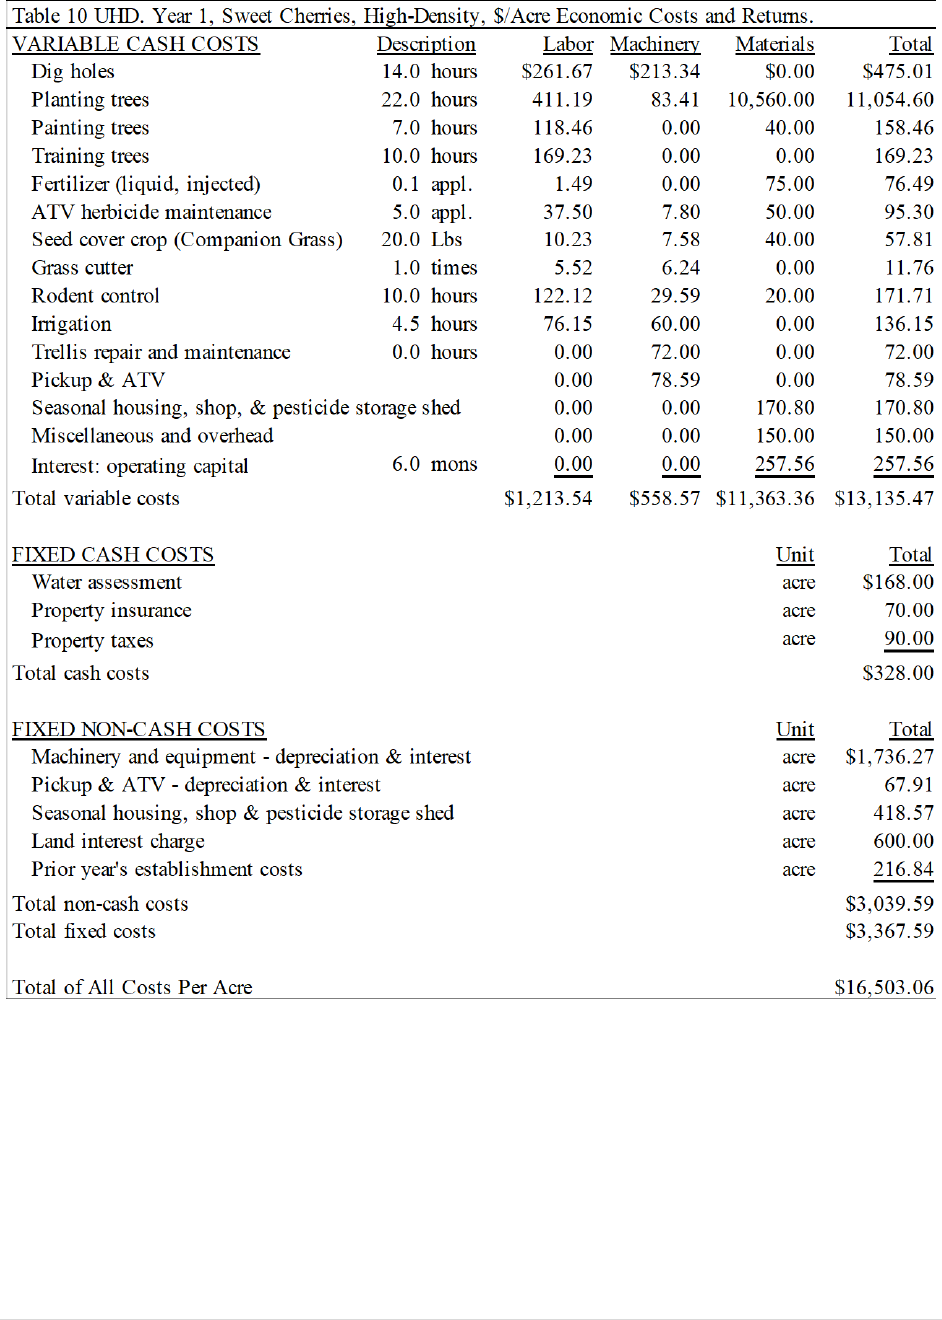
returns by $13,194 in year 7. Appendix E,
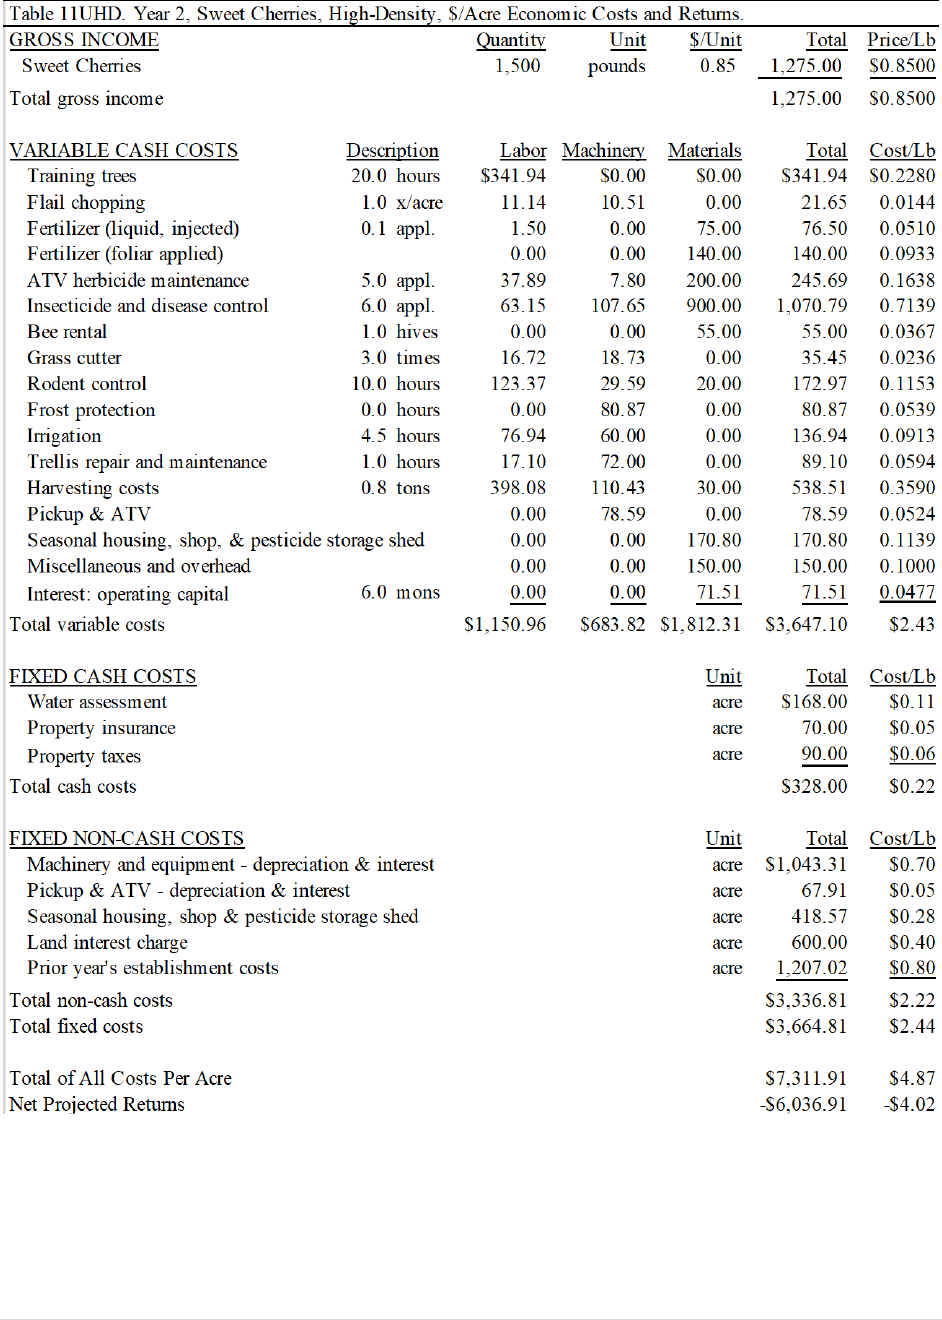
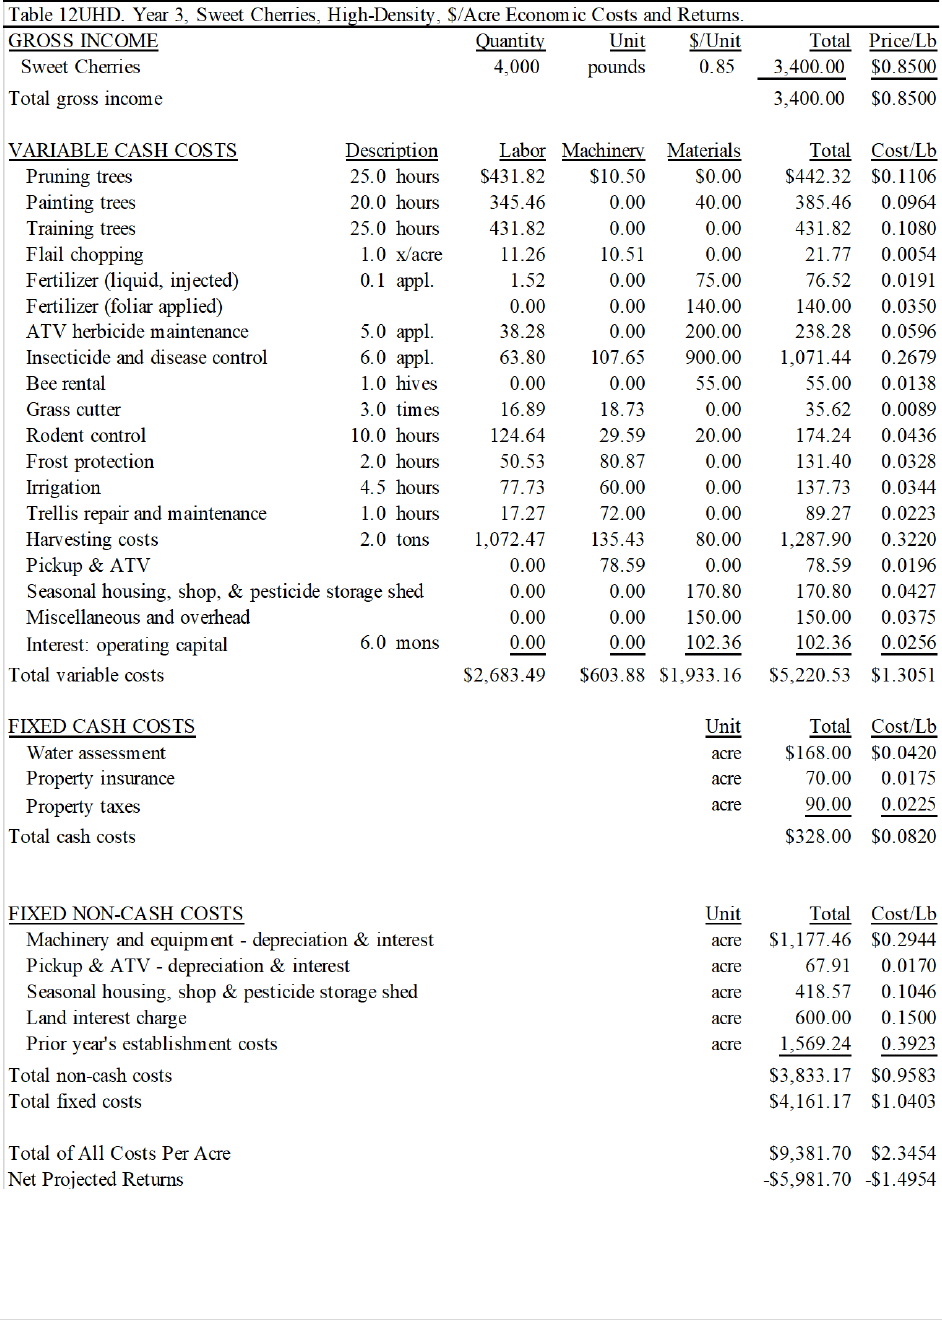
Tables 9UHD-13UHD, pages 28-32, contain
the annual cost and return budgets for
establishing this ultra-high-density sweet
cherry orchard.
Conclusion
Historically, growers in Wasco County
renew orchards when production levels no
longer cover the cash variable costs of
producing cherries. However, as higher
density systems have been proven
economically in the area, interest in
replacing old trees with modern, higher-
density cherry orchards has increased.
Ultra-high-density orchards can offer
higher net returns with higher yields that are
obtained earlier in the life of the investment.
The trade-off, however, is a higher risk due
to more considerable up-front costs and
higher management requirements.
There are two key concepts to consider
when planting an orchard: profitability and
financial feasibility. Profitability determines
if future revenues exceed expenses based on
the time value of money. Financial
feasibility establishes whether the grower
has the equity or can borrow funds for the
investment. The following are economic
theory and financial concepts, focusing on
the outcomes of this study, that growers
should find valuable in determining
management strategies for long-term
business success.

6 | Page
Profit Maximization Theory and
Measuring Profitability
There are three critical factors to
maximizing profits when planting and
establishing tree fruit crops. They are in
order of importance:
1. fruit prices received.
2. yields, not only how much is produced
annually but, more importantly, early
yields in the life of an establishment
period, and
3. establishment costs.
What is often misunderstood is that there
is an absolute either/or trade-off to
maximize profits. This misunderstanding
results in growers concluding that the only
way to increase profits is to avoid or cut
costs. There are two flaws to this reasoning.
First, it may be necessary to increase
operating expenses to increase profits in
some situations. This is possible if these
increases in input costs result in an increase
in revenues. The second flaw in this cost-
minimizing "penny-wise, pound-foolish"
mental trap relates to attitudes about risks.
Spending money on more costly inputs may
increase perceived and/or actual risks.
Hence, many producers are good at
minimizing costs but cannot maximize
profits because they are not investing in
technology, genetics, quality products, or
scale (expansion). It is logical for producers
to be risk-averse. Still, if done in excess, it
can impede the adoption of much-needed
investments. The farm operation will not be
able to compete with other producers who
make the investments and associated
changes. Therefore, risk aversion may create
more risk than otherwise would be. This can
lead growers to focus on avoiding or
reducing expenses when they should be
seeking profit-maximizing strategies by
investing dollars in:
1. growing high, quality fruit.
2. technologies that achieve early and
higher yields.
3. techniques that result in increased
efficiencies.
Economic theory suggests that dollars be
invested if marginal revenues exceed
marginal costs. A few examples would be
investing in the following if the producer
applies the profit maximization theory:
1. higher quality nursery stock.
2. support systems.
3. additional detailed pruning.
4. precision irrigation systems.
As the adage goes, sometimes it takes
money to make money!
Another mental trap is thinking only
about ongoing costs and concluding that all
is well if profits are defined as gross income
minus operating expenses. But this
reasoning does not consider the profitability
of the orchard. As with most perennial crop
investments, there are both up-front
investments and ongoing costs. The
financial metric of net present value captures
an investment's total up-front investments
and stream of future net cash flows to
measure profitability. While profit is an
absolute measure of a positive gain from an
investment, profitability is the profit relative
to the size of the investment. For example,
compare two investments when both earn
$1,000 in profits. One of these investments
was for $10,000, and the other was for
$100,000. The $10,000 investment had
better profitability, even though both
investments generated equal profits.
Profitability measures the efficiency of the
investment to generate profit, as in an
internal rate of return. Unlike profit,
profitability is a relative measure of the rate
of return expected on investments, or the
size of the return, compared to what could
have been obtained from an alternative
investment (opportunity cost). Therefore,
projections could indicate that a new
planting may generate a net profit, but not
necessarily provide long-term profitability

7 | Page
when considering the opportunity cost of the
capital invested.
Addition through Subtraction
It is not uncommon for growers to
remove and plant trees based on available
annual cash flows, which runs counter to
determining replacement based on the
economic life of an orchard. This renewal
strategy can lead to many unproductive
orchards, which creates a challenge for the
farm to survive in the long run.
There is a two-prong approach when
evaluating orchards and renewal: addition
through subtraction and applying financial
management principles to existing resources
to fund more planted acres. The addition
through subtraction concept suggests
removing orchards when revenues do not
exceed cash variable costs, which could
result in several acres without fruit trees.
However, this strategy allows growers to
allocate resources to the more productive
orchards, applying the profit maximization
theory described above. Many times, this
allocation of resources can increase overall
net farm income.
The other strategy is to analyze the
business's financial strength and set limits to
key financial ratios and performance
measures to determine the funds available to
invest in more acres of fruit trees. Over the
long run, this strategy will create
opportunities to replace orchards sooner,
resulting in a higher orchard renewal rate by
increasing net farm incomes.
Takeaways from this study
Cherry growers understand the risks
involved in farming tree fruits, recognizing
most times, they could make more money in
alternative investments of similar risk and
receiving a much higher return on their
investment. The high capital investments in
both orchard systems in this study may
explain the low removal rates of cherry
orchards.
One reason why these systems are so
profitable is they do follow the three critical
factors to successful orchard renewal
discussed earlier due to:
1. planting varieties that provide a
premium price to the grower.
2. planting variety, rootstock, and
training system combinations that
obtain early and higher yields.
3. integrating technologies and
techniques that create efficiencies in
the production system.
A criticism of university cost studies is
they do not include all the regulatory costs
incurred by growers. Although we recognize
these additional costs exist, it is challenging
to itemize them due to the diversity of
growing crops, hiring labor, and providing
housing or not. Another criticism is these
studies do not reflect a specific grower's
costs for their farm. In addition, they include
too many economic costs and assumptions
that some growers do not have. The
following section will discuss how growers
can use the AgBiz Logic decision tool to
modify the information from this study as
their own.
Using AgBizLogic™ to Analyze Different
Price and Yield Scenarios
Different price and yield scenarios can
give growers a greater appreciation of the
financial risk involved in orchard
establishment or renewal. In addition,
numerous factors and unforeseen events
(e.g., damage from a freeze, rain, hail,
changes in market conditions) can impact
yield and price, which are ignored in this
study.
AgBiz Logic
TM
(ABL) is an online
decision tool that considers economic and
financial factors when analyzing
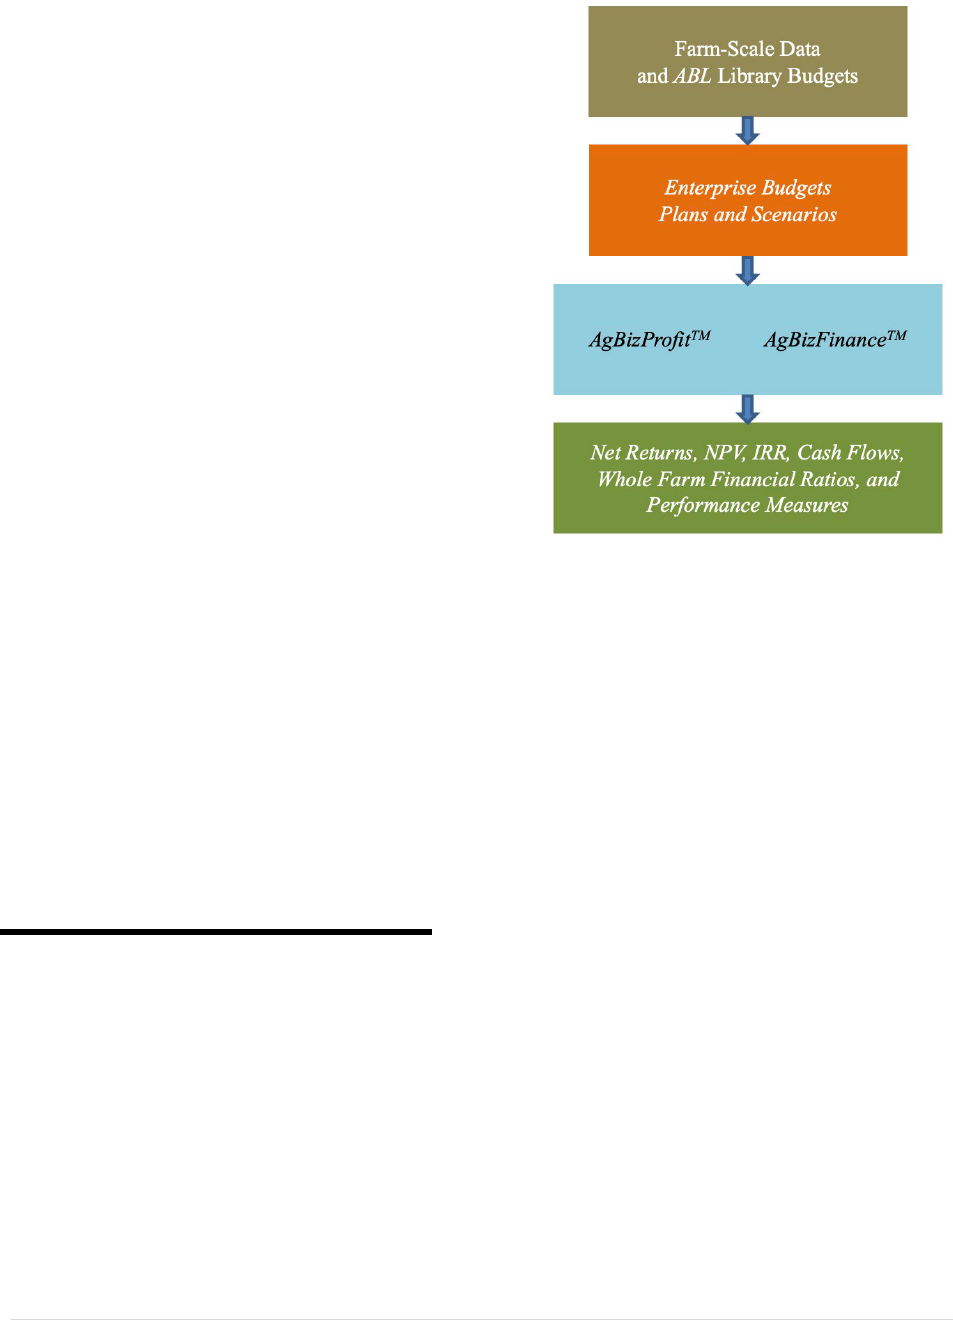
investments. The following schematic shows
the data flow and results from the ABL
decision tool. Grower farm-level data is
collected from the tax form Schedule F
(Form1040) to generate enterprise budgets.
8 | Page
In addition, enterprise budgets from
universities, industry and USDA-ERS are
stored in the ABL Library for grower use
when returns and inputs are unknown
(brown). Enterprise budgets are sequenced
in ABL plans and adjusted for inflation,
discount rates, and beginning and ending
investment values which provide the basis
for a capital investment analysis (orange).
Scenarios consist of several plans that can
be compared and are required for the ABL
tools (blue) to calculate the economic and
financial outputs (green).
The AgBizProfit
TM
module enables users
to make capital investment decisions by
measuring an investment's profitability
based on its Net Present Value, Internal Rate
of Return, and cash flow breakeven.
The module AgBizFinance
TM
empowers
producers to make whole-farm investment
decisions based on 20 financial ratios and
performance measures. In addition, this
program lets users input their current
balance sheet information, loans, and capital
leases.
AgBizFinance uses this information with
plans and scenarios to generate up to 10
years of proforma cash flow statements,
balance sheets, and income statements. As a
result, growers can evaluate how orchard
renewal plans can impact their short- and
long-term finances and how best to fund
capital investments.
These AgBizLogic decision tools can
currently be accessed at
https://www.agbizlogic.com or
https://www.agbizlogic.oregonstate.edu at
no cost. Also, budgets from this study will
be available in the ABL Library.
It is recommended that before investing
in any long-run perennial crop, the potential
investor use AgBiz Logic modules to
thoroughly analyze the profitability and
financial feasibility of potential investments
under varying price and yield scenarios.
AgBiz Logic Example
From a horticultural perspective, finding
the appropriate variety, rootstock, and
training system combination is critical to
orchard renewal. These factors can generate
large, firm fruit, early and higher annual
yields, and orchard labor efficiencies.
However, problems arising from
mismatched training systems or rootstocks
can be a horticultural nightmare. Some of
the issues can be poor quality fruit and/or
reduced yields, which results in lower
returns to the grower. Labor requirements
can also increase, which drives up costs of
production.
The question growers face is whether to
remove a young orchard and start over or
graft or perform heavy pruning to prune
trees to a different training system. Although
the former generated a profit during its early
life, it may not have yielded sufficient net

9 | Page
returns to provide an acceptable rate of
return on investment to the grower. The
latter can be less expensive and has the
potential to reach full production much
earlier. However, other factors, such as labor
inputs, could be higher in the future.
This dilemma is an excellent example of
how AgBiz Logic can assist growers in these
situations. This tool can generate an
economic and financial assessment of
whether to replant to a new orchard or stay
the course with the variety and rootstock but
perform heavy pruning to a new training
system. The following are assumptions used
in AgBiz Logic budgets and scenarios to
conduct such an analysis. Next, the
AgBizProfit module will generate a net
present value analysis to compare the
profitability and costs of establishing each
system.
Assumptions
1. New Orchard. The returns and costs of
establishing a new orchard will come
from this study as described in the high-
density sweet cherry system.
2. Steep Leader System. The costs to
perform heavy pruning are estimated to
be $500 per acre, which includes the
labor to make the significant cuts, load,
and haul limbs from the field.
3. The costs to maintain the trees will be
the same as in the full production year
of the high-density system. However,
there will be no pest and disease control
costs, and fertilizer inputs will decrease
by 50 percent until the trees begin to
bear fruit. These costs then increase
with annual production, as in the high-
density orchard.
4. Harvest and beehive costs are excluded
until reaching commercial yields.
5. Labor increases by 30 percent for all
tasks in the orchard.
6. Production begins in year 3 with 1,000
pounds, 4,000 in year 4, 8,000 in year 5,
10,000 in year 6, and reaches full
production in year 7 with 14,000
pounds per acre.
7. The time horizon to evaluate these
investments will be 20 years.
8. The discount rate will be six percent.
9. The beginning investment value will be
$15,000 per acre for the new orchard
and $20,000 for the heavy pruning
option. The ending investment value
will be $30,000 for each orchard
system.
RESULTS
An AgBizProfit analysis compares
multiple investments simultaneously, which
allows the grower to quickly evaluate each
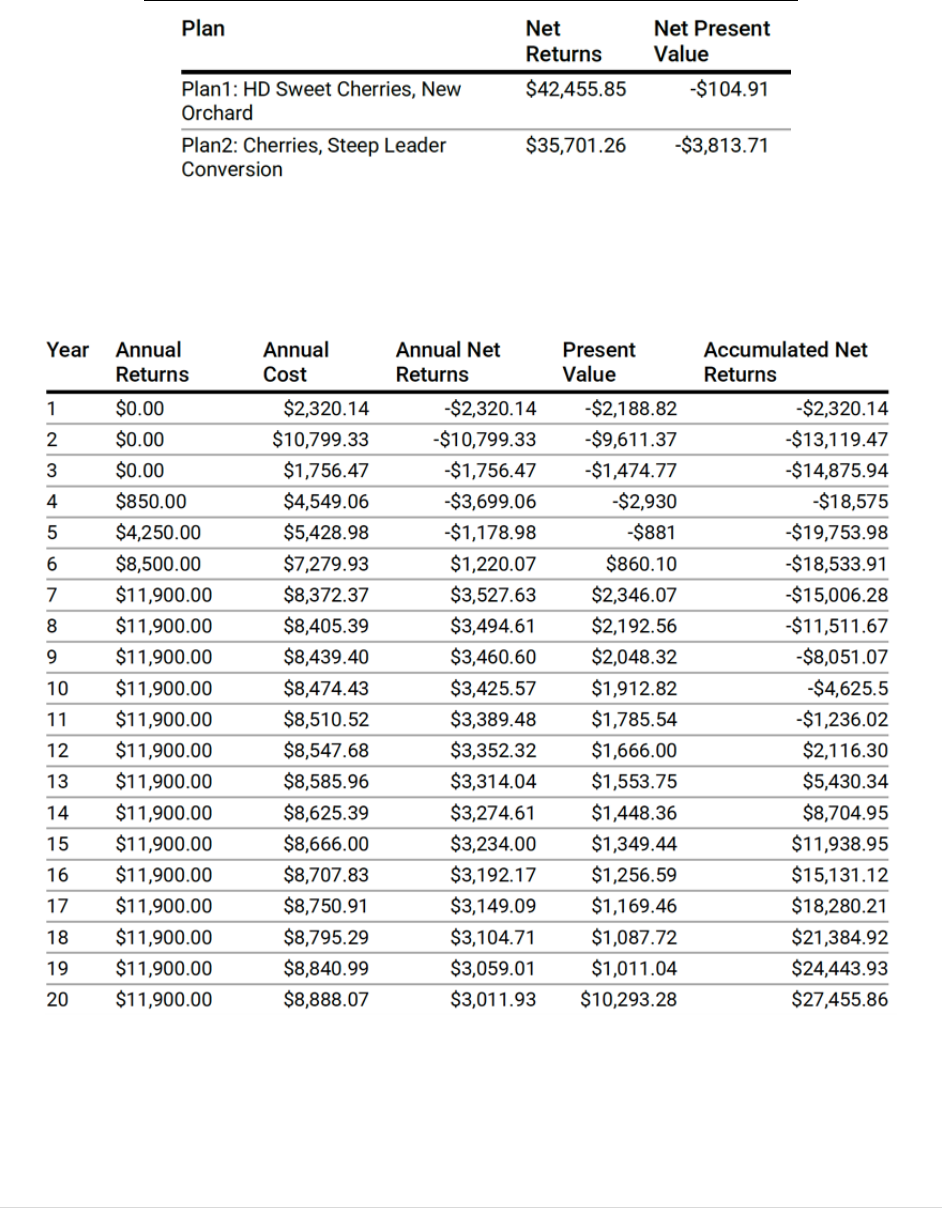
on its own merits. Table ABL1, page 10,
shows planting a new orchard system has a
higher net present value, although negative,
than the heavy pruning option. The net
present value to renew the orchard is -$105
per acre, while the steep leader conversion is
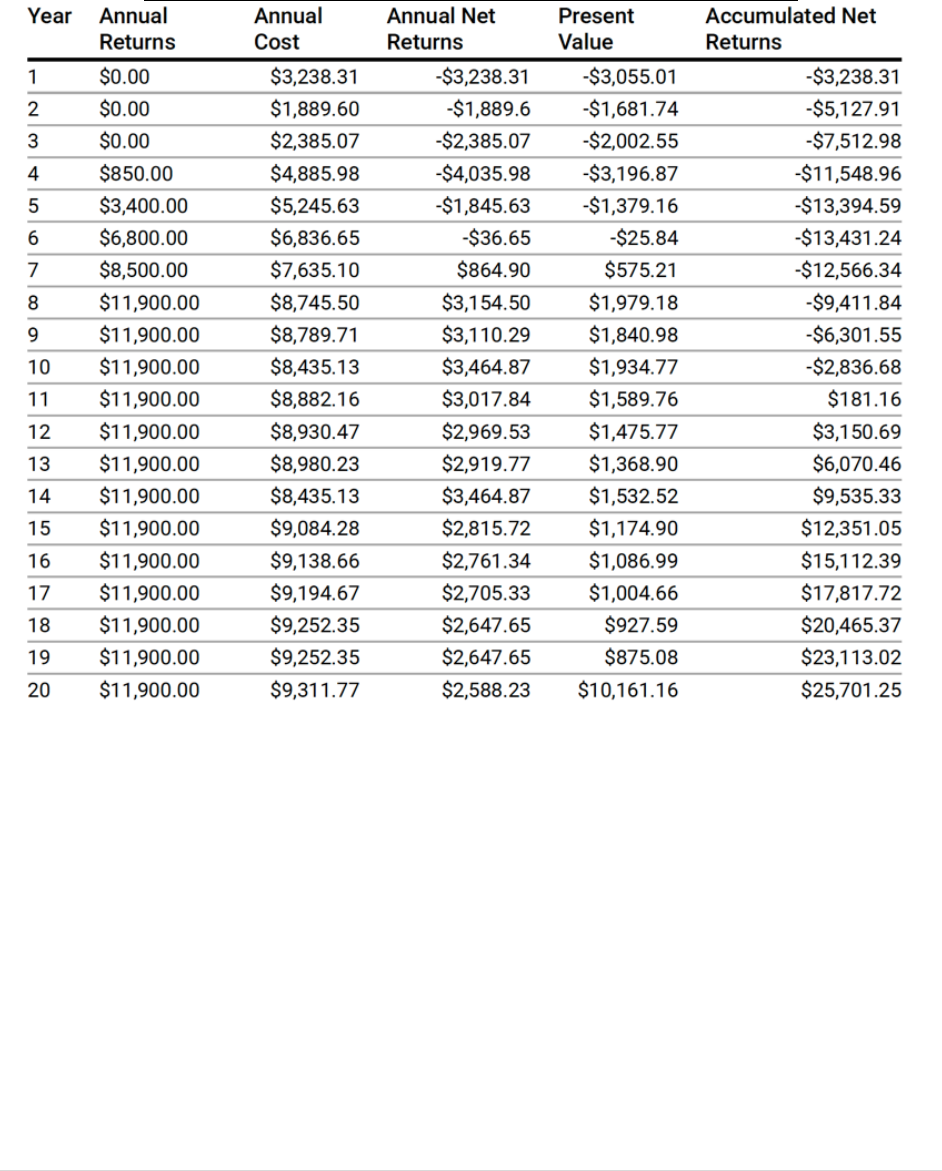
-$3,814. Tables ABL2 and ABL3, pages 10
and 11, show the annual returns, costs, and
net returns, as well as the present value of
each year and the accumulated net returns
before discounting. The year that returns are
greater than the total costs of previous years
is 12 for the new orchard and 11 for the
conversion.
Although there are numerous
combinations of varieties, rootstocks, and
training systems to convert young but
unprofitable orchards, this is one example of
how to use the AgBiz Logic program. The
ABL budgets used in this analysis are
located in the AgBiz Logic library. Look for
“EXTENSION” in the budget title, followed
by “Steep Leader” …”.
We encourage growers to create an AgBiz
Logic account to evaluate the economics and
financial implications of similar situations.
10 | Page
Table ABL1. Total Net Returns and Net Present Value to Establish
a High-Density Orchard and Converting an Orchard to a Steep
Leader Training System.
Table ABL2. Annual Returns, Costs, and Net Returns, Present
Values, and Accumulated Net Returns Before Discounting to
Establish a New High-Density Orchard.
11 | Page
Table ABL3. Annual Returns, Costs, and Net Returns, Present
Values, and Accumulated Net Returns Before Discounting to
Convert an Existing Orchard to a Steep Leader Training System.
12 | Page
APPENDIX A
Machinery and Equipment Assumptions and Cost Calculations for a 100-acre Orchard in
Wasco County.
13 | Page
14 | Page
APPENDIX B
Input Assumptions for Establishing a High-Density and Ultra-High-Density Sweet Cherry
Orchard in Wasco County.
15 | Page
16 | Page
APPENDIX C
Cash Costs and Economic Returns and Costs to Establish a High-Density and Ultra-High-
Density Sweet Cherry Orchard.

17 | Page
18 | Page
19 | Page
20 | Page
21 | Page
APPENDIX D
Annual Enterprise Budgets to Establish a High-Density Sweet Cherry Orchard.
22 | Page
23 | Page
24 | Page
25 | Page

26 | Page
27 | Page
28 | Page
APPENDIX E
Annual Enterprise Budgets to Establish an Ultra-High-Density Sweet Cherry Orchard
29 | Page
30 | Page
31 | Page
32 | Page
